How badly did the 2020 Holiday Farm Fire burn the soil in Watersheds 1 and 9?
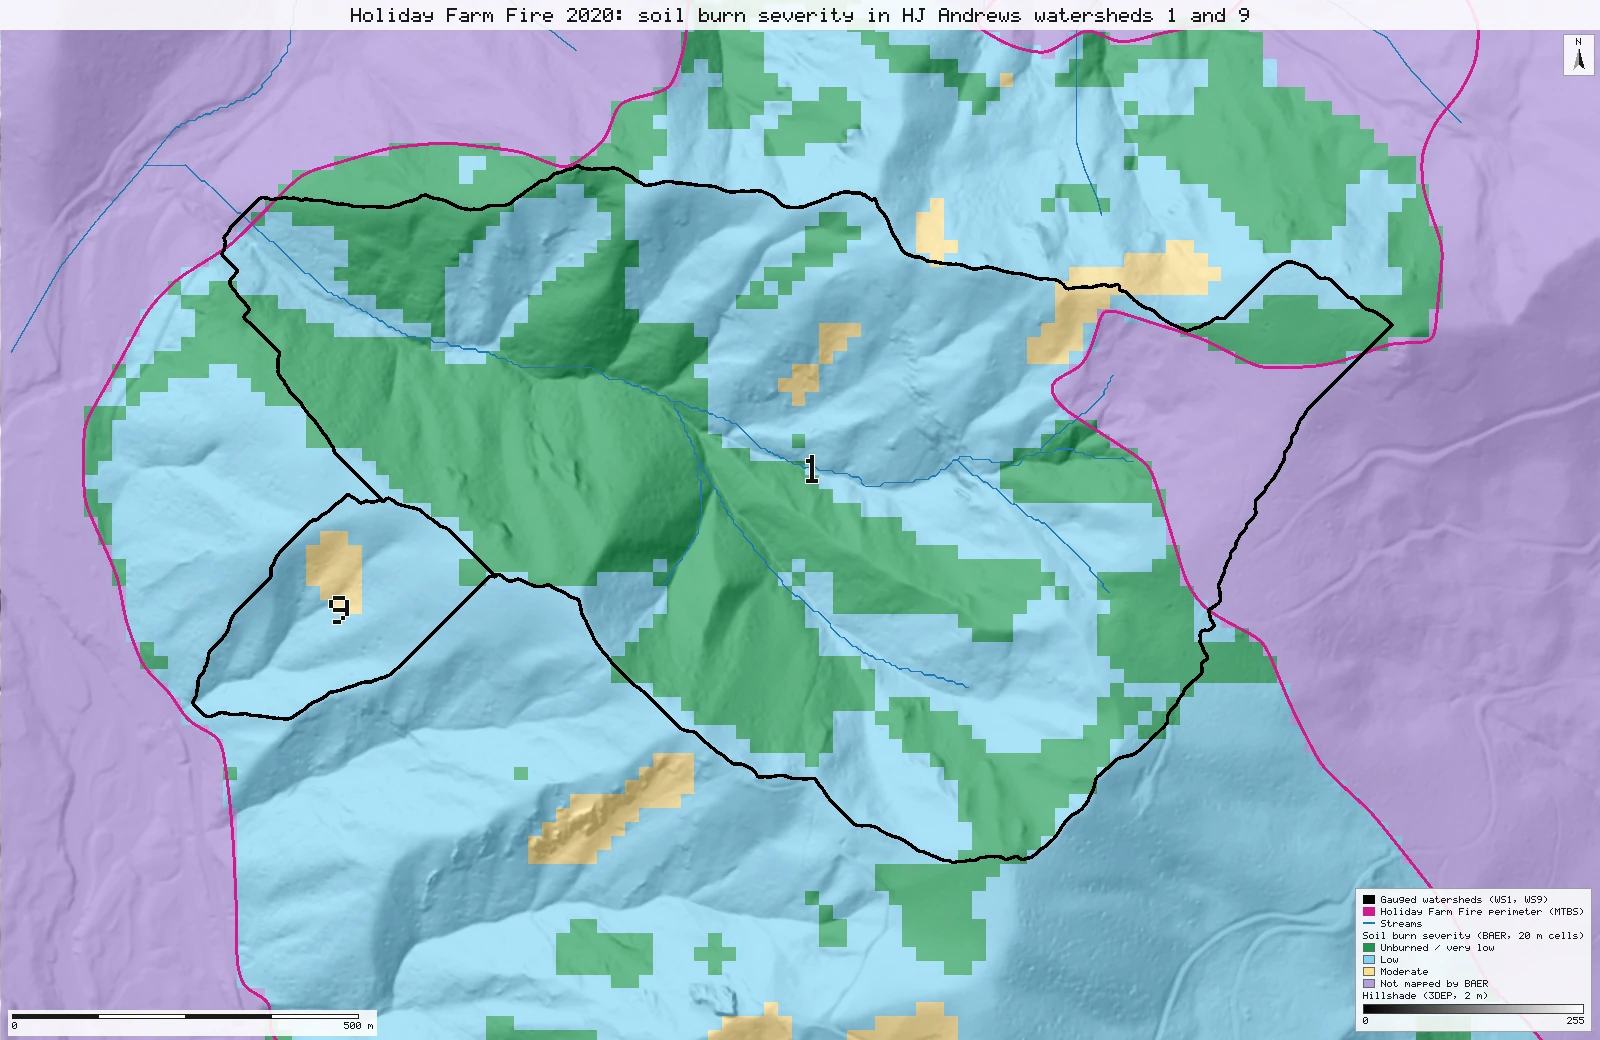
Watershed 9 and the whole-fire shares match the paper to the percent. Watershed 1 matches to within half a percent, except the 8% the paper lists as high severity. That 8% equals the part of the watershed BAER did not map, mostly outside the fire. It is exactly what reading the raster's no-data value as high severity gives: most likely a coding slip.
- WS9 low88% → 88.3% +0.3 ptsmatch
- WS9 moderate10% → 9.7% −0.3 ptsmatch
- WS1 unburned48% → 47.9% −0.1 ptsmatch
- WS1 low42% → 42.5% +0.5 ptswithin tolerance
- WS1 moderate1% → 1.4% +0.4 ptsmatch
- WS1 high8% → 0.0% −8.0 ptsexplained why
- WS1 share outside the mortality rows7% → 8.1% +1.1 ptswithin tolerance
[19]
[13, 15, 17]
[10, 19]
Numbers in brackets, like [14], are step numbers in this study's run.json: the NativeGIS call that returned the figure. NativeGIS 0.3.0, recorded 2026-10-31 05:33 UTC.
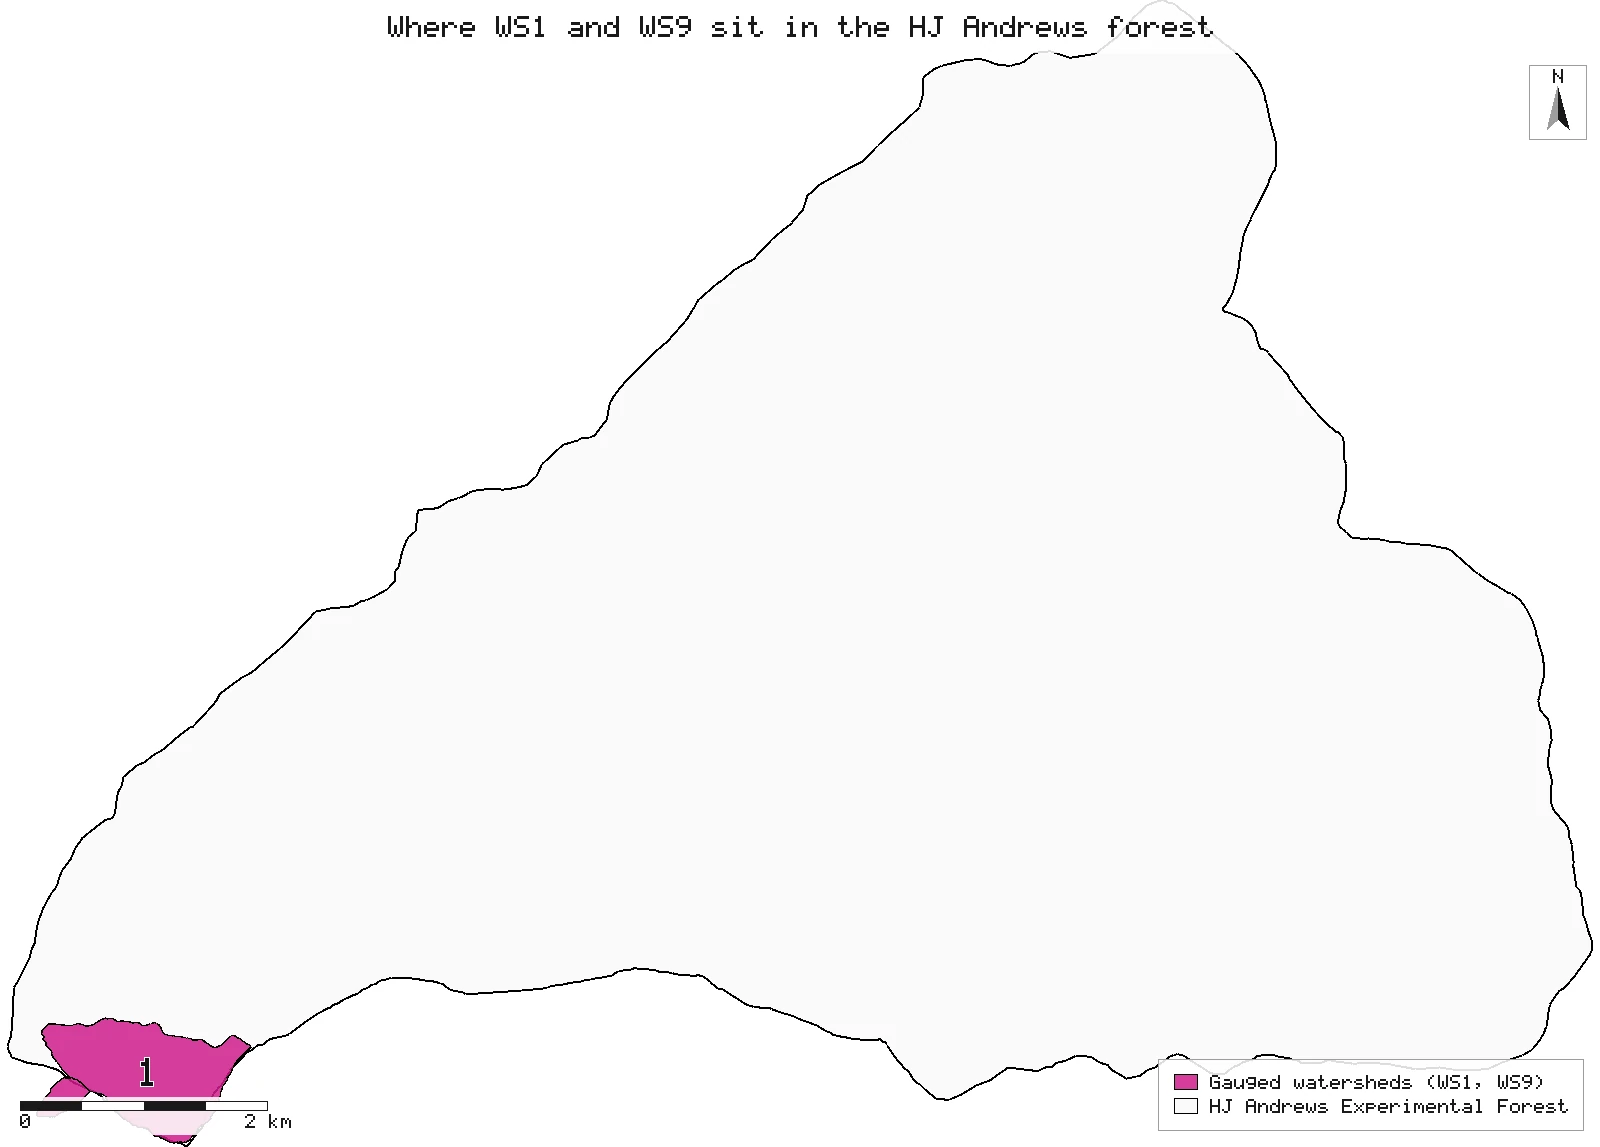
Where the watersheds are, and the whole fire
Left: WS1 and WS9 (magenta) in the HJ Andrews forest. Right: the whole Holiday Farm Fire as BAER mapped it, with the forest and the two watersheds outlined.
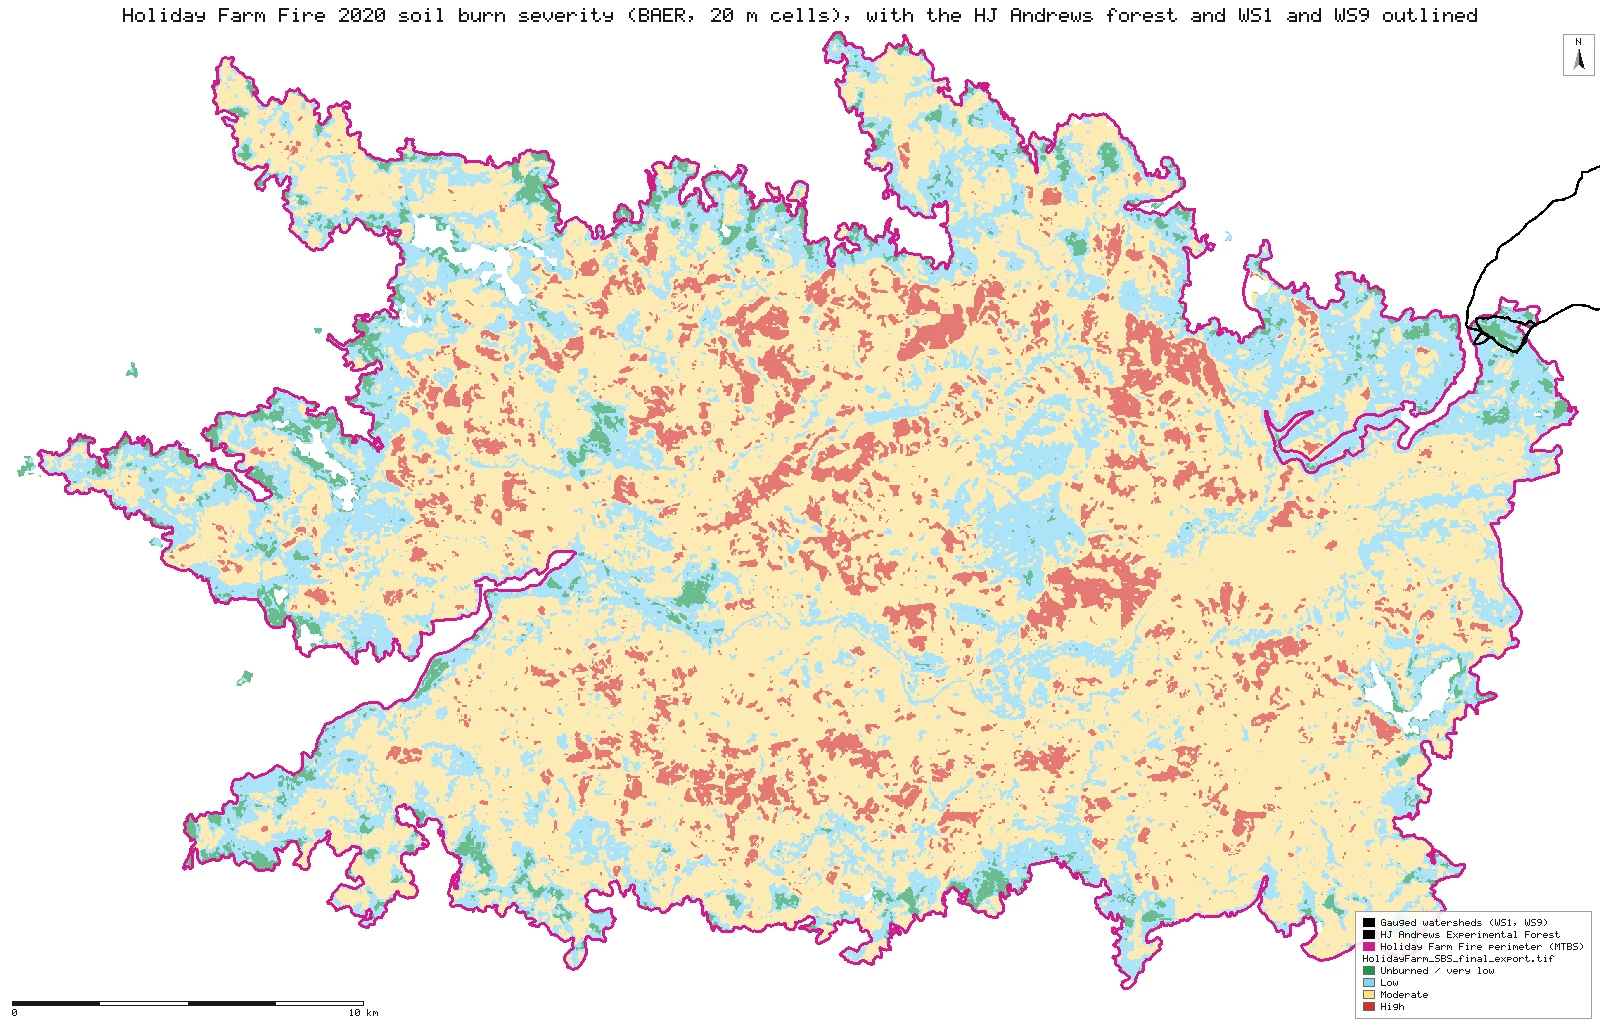
Click or tap a map to open it full screen, then zoom and pan.
What was published
Table 1(a)(i), soil burn severity as a percentage of each watershed, and the text on page 3 for the whole fire: low 24%, moderate 62%, high 9%. The paper names the BAER soil burn severity dataset for the fire but gives no version, cell size, or rule for clipping to the watersheds. The watersheds are the HJ Andrews gauged experimental watersheds, 96 ha (WS1) and 8.5 ha (WS9) in the paper.
Paper (DOI) · HJ Andrews reprint (pub5352, PDF) · Accepted manuscript (NSF Public Access Repository, PDF) · BAER Imagery Support Program data access
The data and where it came from
All of it is open: downloaded without an account or a form.
| Data | Where | Licence |
|---|---|---|
| BAER soil burn severity for the Holiday Farm Fire (item HolidayFarm_SBS_final, 4 classes: 1 unburned or very low, 2 low, 3 moderate, 4 high; 0 = not mapped), 20 m cells, NAD83 UTM zone 10N | USFS Enterprise Data Warehouse BAER soil burn severity image service (the service the BAER data-access page links to). The file is exported on the item's own 20 m grid and extent, nearest neighbour, uncompressed GeoTIFF, 2.5 MB, no form or account. The BAER viewer's own download bundle asks for an e-mail address, so it was not used. https://imagery.geoplatform.gov/iipp/rest/services/Fire_Aviation/USFS_EDW_BAER_SoilBurnSeverityClassification/ImageServer | US federal data, public domain |
| HJ Andrews gauged watersheds (Hydrology 2018, layer 5): 10 polygons with Wshed number and Area_ha; WS1 97.2 ha, WS9 7.9 ha | Oregon State University HJ Andrews open-data hub, GeoJSON from the public feature service, 1.6 MB, no form or account https://services1.arcgis.com/CD5mKowwN6nIaqd8/arcgis/rest/services/HJ_Andrews_Hydrology__2018_/FeatureServer/5 | HJ Andrews data policy (CC BY, acknowledgement requested) |
The input files the run read, pinned by checksum
| File (relative to the data folder) | Bytes | sha256 |
|---|---|---|
samples/bush-2024/sbs/HolidayFarm_SBS_final_export.tif | 2,574,756 | bb278edfed7c53a6… |
samples/bush-2024/ws/hja_gauged_watersheds.geojson | 1,645,111 | 8bc4453fe3897657… |
samples/bush-2024/sbs/HolidayFarm_SBS_final_export_raw.tif | 3,541,400 | e9fbede16d1f2b99… |
samples/holiday-farm/x/or4417212223120200908_20190720_20210725_burn_bndy.shp | 947,164 | 1197bd6fa2ecb3d2… |
samples/holiday-farm/x/or4417212223120200908_20190720_20210725_dnbr6.tif | 2,168,982 | c8a1865fce299f2d… |
samples/bush-2024/dem/ws1_ws9_dem_2m.tif | 8,521,898 | 5bff23972066d0ce… |
samples/hja-open/hf01301/x/hydro.shp | 173,308 | 263271acd998f7bd… |
samples/hja-open/gi00601/x/boundary83.shp | 10,540 | 0774de0a9ebd9693… |
Full checksums are in run.json. Replay refuses an input whose checksum differs.
Method
- Open the soil burn severity raster (EPSG:26910, metres, 20 m cells, 0 = not mapped) and check it against what the image service states for the item: same extent and grid, classes 1 to 4, mean class 2.76.
- Open the watersheds (WGS84), select WS1 and WS9, and reproject them to EPSG:26910 so they share the raster's grid. Nothing in the raster is resampled.
- Make a 0/1 raster of where BAER mapped a class, and one 0/1 raster per severity class. The mean of a class raster over the whole raster is that class's share of the fire. Its zonal mean over a watershed is the class's share of the watershed's mapped cells. A cell counts for a watershed when its centre is inside the polygon.
- Read the shares and cell counts back, and draw two maps: the two watersheds over the severity classes with unmapped cells in grey, and the whole fire.
The run made 64 NativeGIS calls: gis_open × 8, gis_info × 1, gis_query × 6, gis_process × 43, gis_render × 6.
Published numbers next to ours
Watershed 1
| Soil burn severity | Published (Table 1) | NativeGIS, share of the watershed | NativeGIS, share of mapped cells | Cells |
|---|---|---|---|---|
| Unburned or very low | 48% | 47.9% | 52.2% | 1,167 |
| Low | 42% | 42.5% | 46.3% | 1,035 |
| Moderate | 1% | 1.4% | 1.5% | 34 |
| High | 8% | 0.0% | 0.0% | 0 |
| Not mapped by BAER | 8.1% | 198 | ||
| All cells with their centre inside | 99% | 100% | 100% | 2,434 |
Published WS1 drainage area 96 ha; the polygon used here is 97.2 ha (EPSG:26910) [8] and holds 2,434 cell centres [10], 2,236 of them with a BAER class. Read the "share of the watershed" column against the paper: unburned, low and moderate agree to within half a percent, and the paper's high-severity row holds the 8.1% that is not mapped.
Watershed 9
| Soil burn severity | Published (Table 1) | NativeGIS, share of the watershed | NativeGIS, share of mapped cells | Cells |
|---|---|---|---|---|
| Unburned or very low | 2% | 2.0% | 2.0% | 4 |
| Low | 88% | 88.3% | 88.3% | 173 |
| Moderate | 10% | 9.7% | 9.7% | 19 |
| High | 0% | 0.0% | 0.0% | 0 |
| Not mapped by BAER | 0.0% | 0 | ||
| All cells with their centre inside | 100% | 100% | 100% | 196 |
Published WS9 drainage area 8.5 ha; the polygon used here is 7.9 ha [8]. Every one of its 196 cells is mapped, so both columns are the same. At this size one cell is 0.5% of the watershed.
The whole fire
| Soil burn severity | Published (text) | NativeGIS | Cells |
|---|---|---|---|
| Unburned or very low [11] | not given | 4.3% | 75,666 |
| Low [13] | 24% | 24.4% | 427,277 |
| Moderate [15] | 62% | 62.0% | 1,084,897 |
| High [17] | 9% | 9.3% | 162,930 |
| Mapped cells | 100% | 1,750,770 |
Method: 0/1 indicator rasters, one per BAER class, from the 20 m soil burn severity raster (EPSG:26910); shares are their means, over the whole raster for the fire and over cells whose centre is inside each watershed polygon for WS1 and WS9 [10, 11, 13, 15, 17, 19]. Units: per cent of 20 m cells (400 m² each). n = 1,750,770 mapped cells for the fire, 2,434 cells in WS1, 196 in WS9. Rounded to whole percent, every published WS9 and whole-fire figure is matched.
Why WS1's high-severity share differs
The paper gives Watershed 1 as 48% unburned or very low, 42% low, 1% moderate and 8% high. Here no cell of Watershed 1 has the BAER high class. Instead 8.1% of it has no class at all. Three explanations were tested.
| Handling of the cells BAER did not map | WS1 unburned / low / moderate / high | WS9 | Reproduces Table 1? |
|---|---|---|---|
| Published (Table 1) | 48 / 42 / 1 / 8% | 2 / 88 / 10 / 0% | |
| Left out, shares of the mapped cells [19] | 52.2% / 46.3% / 1.5% / 0.0% | 2.0% / 88.3% / 9.7% / 0.0% | No: unburned and low come out 4 points high |
| Kept as "no class", shares of the whole watershed [19] | 47.9% / 42.5% / 1.4% / 0.0% (+ 8.1% none) | 2.0% / 88.3% / 9.7% / 0.0% | Three of four WS1 rows; high is 0, not 8 |
| Their raw value, 15, read as a class: "4 or more = high" [22, 31] | 47.9% / 42.5% / 1.4% / 8.1% | 2.0% / 88.3% / 9.7% / 0.0% | Yes: every WS9 row, and WS1 unburned, moderate and high, to the whole percent. WS1 low is 42.5 against 42, the same 13-cell gap as in the other handlings. |
- A no-data value read as a class. In the soil burn severity raster the classes are 1 to 4, and cells BAER did not map hold 15 when no no-data value is set (1,536,190 such cells in the export, and no value other than 1–4 and 15 [21]). A rule such as "4 or more = high", or simply not declaring 15 as no-data, turns every unmapped cell into high severity. That reproduces the published WS1 high-severity figure exactly, and the rest of the row as closely as any handling does: low is half a point off, from 13 cells along the boundary. It leaves WS9 as published, because WS9 has no unmapped cells.
- A different product. The unmapped part of Watershed 1 is 7.9 ha, and only 0.2 ha of it (2.7%) lies inside the MTBS fire perimeter [35, 42]. In MTBS's own map of the fire, those cells are 17 unburned-to-low, 2 low, 1 moderate and 0 high [46]. Ground outside the fire that MTBS sees as unburned is unlikely to be high severity in any version of the BAER map. The unedited BARC and any initial SBS were not checked: the BAER portal asks for an e-mail address before download.
- A gap in this export. The export uses the image service's own 20 m grid and extent for this raster, and the service's statistics list only classes 1 to 4. So the unmapped cells are unmapped in the published product, not cut off by the download.
A check inside the paper's own Table 1
Table 1 has a second half: basal-area mortality in the same two watersheds, from a separate regional mortality product (Stratton 2021), in four rows from unburned to high. Summing each half's rows, as printed in the accepted manuscript:
| Table 1 rows, summed | WS1 | WS9 |
|---|---|---|
| (i) Soil burn severity: 48 + 42 + 1 + 8 (WS1) | 99% | 100% |
| (ii) Basal-area mortality: 70 + 9 + 12 + 2 (WS1) | 93% | 98% |
| NativeGIS: share of cells with no BAER class [10, 19] | 8.1% | 0.0% |
Four rounded rows can miss 100 by up to 2 points, which covers WS9 (98%). WS1's mortality rows fall 7 points short, about the 8.1% of WS1 that BAER left unmapped, while its soil burn severity rows add to 99%. That fits the same ground being left out of one half of the table and counted as high severity in the other. It is consistent with the coding slip above; it does not prove it, because the mortality product's own coverage of WS1 is not published.
Most likely explanation: the published 8% high in Watershed 1 equals the share of the watershed BAER did not map, to the cell. It is what a no-data value of 15 read as the highest class would give. It is probably a coding slip, and the likely correction is: Watershed 1 high severity 0%, with about 8% of the watershed outside the mapped burn area. The paper's comparison of high severity between WS1 and WS9 (8% against 0%) would then not hold. We have not contacted the authors.
Could the published 8% be right?
We looked for any honest way to get the paper's numbers (WS1 48 / 42 / 1 / 8, WS9 2 / 88 / 10 / 0: unburned / low / moderate / high) without reading BAER's no-data value as high: other severity products, other WS1 boundaries and buffers, other reference areas, other denominators. None fits. Every honest setup puts 0 to 2.2% of WS1 at high severity, and most cannot match WS9 either. The only setup that fits both watersheds to within a point is the no-data reading: WS1 47.9 / 42.5 / 1.4 / 8.1, WS9 2.0 / 88.3 / 9.7 / 0.0 [93, 96].
| Severity product | WS1 U / L / M / H (%) | WS9 U / L / M / H (%) | Largest gap to the paper (points) |
|---|---|---|---|
| Published (Table 1) | 48 / 42 / 1 / 8 | 2 / 88 / 10 / 0 | |
| BAER final, no-data read as high (the slip) | 47.9 / 42.5 / 1.4 / 8.1 | 2.0 / 88.3 / 9.7 / 0.0 | 0.5 |
| BAER soil burn severity, final (the dataset the paper names) (20 m) [93, 96] | 52.2 / 46.3 / 1.5 / 0.0 | 2.0 / 88.3 / 9.7 / 0.0 | 8.0 |
| MTBS severity classes (extended assessment) (30 m) [174, 177] | 53.8 / 38.5 / 6.3 / 1.4 | 8.0 / 64.4 / 23.0 / 4.6 | 23.6 |
| MTBS dNBR at this fire's MTBS thresholds (30 m) [195, 198] | 55.3 / 37.4 / 6.0 / 1.3 | 8.0 / 64.4 / 23.0 / 4.6 | 23.6 |
| MTBS RdNBR, Miller & Thode 2007 thresholds (30 m) [216, 219] | 64.2 / 26.9 / 6.7 / 2.2 | 12.6 / 52.9 / 21.8 / 12.6 | 35.1 |
| RAVG composite burn index (initial assessment) (30 m) [237, 240] | 70.9 / 23.6 / 5.1 / 0.5 | 35.6 / 49.4 / 12.6 / 2.3 | 38.6 |
| RAVG RdNBR, Miller & Thode 2007 thresholds (30 m) [258, 261] | 69.9 / 24.1 / 5.3 / 0.7 | 34.5 / 47.1 / 13.8 / 4.6 | 40.9 |
| RAVG dNBR, Key & Benson 2006 ranges (30 m) [279, 282] | 81.9 / 12.0 / 5.8 / 0.4 | 50.6 / 31.0 / 16.1 / 2.3 | 57.0 |
| Our own dNBR from the RAVG Sentinel-2 pair, Key & Benson ranges (30 m) [344, 347] | 81.9 / 12.0 / 5.8 / 0.4 | 50.6 / 31.0 / 16.1 / 2.3 | 57.0 |
Shares of the cells that carry a class (1 to 4); a cell belongs to a watershed when its centre is inside it. Our own dNBR from the Sentinel-2 pair matches RAVG's to within one unit, so it gives the same classes.
| Other WS1 outlines and areas (BAER final) | U / L / M / H (%) | No-data read as high |
|---|---|---|
| WS1, 2001 boundary [109] | 51.2 / 46.8 / 2.0 / 0.0 | 47.6 / 43.5 / 1.8 / 7.1 |
| WS1, 1997 boundary [115] | 49.7 / 48.8 / 1.4 / 0.0 | 46.1 / 45.2 / 1.3 / 7.4 |
| WS1 with 1a [121] | 49.8 / 48.8 / 1.4 / 0.0 | 45.6 / 44.7 / 1.3 / 8.4 |
| WS1, HJA HF014-01 [124] | 49.8 / 48.8 / 1.4 / 0.0 | 45.5 / 44.7 / 1.3 / 8.5 |
| WS1 + 30 m [130] | 49.7 / 48.6 / 1.8 / 0.0 | 45.2 / 44.2 / 1.6 / 8.9 |
| WS1 + 100 m [136] | 44.3 / 53.1 / 2.6 / 0.0 | 38.8 / 46.6 / 2.3 / 12.3 |
| WS1 + 200 m [139] | 38.9 / 58.2 / 2.9 / 0.0 | 31.7 / 47.4 / 2.3 / 18.5 |
| WS1 + 500 m [142] | 30.0 / 64.6 / 5.4 / 0.0 | 18.4 / 39.6 / 3.3 / 38.7 |
| WS1 + 1 km [145] | 24.1 / 69.3 / 6.6 / 0.0 | 11.3 / 32.6 / 3.1 / 53.0 |
| WS1 inside the fire perimeter [151] | 52.2 / 46.3 / 1.5 / 0.0 | 52.2 / 46.3 / 1.5 / 0.0 |
| WS1 + WS2 [102] | 48.8 / 48.8 / 2.4 / 0.0 | 35.6 / 35.6 / 1.7 / 27.1 |
| HJ Andrews inside the fire [148] | 48.7 / 49.3 / 2.1 / 0.0 | 43.8 / 44.3 / 1.9 / 10.1 |
- No high severity near WS1 at all. BAER maps no high-severity cell in any WS1 outline, in any buffer out to 1 km, or in the box 1 km beyond WS1 (0 of 28,424 cells) [157]. The first appear 1 to 2 km away (108 cells in the 2 km box) [160]. With no high cells in the watershed, no denominator gives 8%.
- The size matches the unmapped strip, and nothing else. BAER leaves 7.92 ha of WS1 unmapped; 8% of the paper's 96 ha is 7.7 ha.
- The paper's own map agrees. Its Figure 1 (soil burn severity over WS1 and WS9) shows no high severity anywhere in WS1, and leaves WS1's east lobe unmapped. We describe the figure rather than reproduce it.
- Vegetation measures do not give 8% either. RAVG's basal-area and canopy loss put under 1% of WS1 in their top class; the paper's own Table 1(ii) lists 2%.
- Not tested: BAER's preliminary BARC map and the initial (non-final) soil burn severity. The public image service holds only the final map; the others come behind a download form that asks for an e-mail address.
Every count above is a reclassify tally in could-8-run.json (348 steps; it replays identically in a fresh session). Inputs are public downloads: the BAER image service export, the MTBS and RAVG bundles for the fire, and the HJ Andrews watershed layers.
Why any numbers differ
- Watershed 9 and the whole fire match. Rounded to whole percent, every published share is what NativeGIS measures from the BAER map.
- The paper's 8% "high" in Watershed 1 matches the unmapped part. BAER has no class for 8.1% of Watershed 1, its eastern lobe, which is almost all outside the fire perimeter (grey on the map). Not one cell inside Watershed 1 has the high class. Reading the raster's no-data value (15) as "4 or more = high" reproduces the published 8% exactly. The tests are set out under Why WS1's high-severity share differs.
- Low severity in Watershed 1 is 42.5%, not 42%. That is 13 of 2,434 cells. The paper does not say how it clipped the map to the watershed, and its four WS1 shares add to 99%, so it probably rounded down or used a slightly different boundary or clipping rule.
Replay it yourself
The run file records every call, its arguments, the checksums of the files it read and the numbers it returned. Replaying it repeats every call in a fresh NativeGIS session and checks that each answer comes out the same.
- Make an empty data folder and fetch the inputs into it exactly as below (bash; the folder layout is the one the run file expects):
cd /path/to/an/empty/folder
mkdir -p samples/bush-2024/sbs && curl -fL -o samples/bush-2024/sbs/HolidayFarm_SBS_final_export.tif 'https://imagery.geoplatform.gov/iipp/rest/services/Fire_Aviation/USFS_EDW_BAER_SoilBurnSeverityClassification/ImageServer/exportImage?bbox=517347.78446994728,4875154.4185595661,562747.78446994722,4904114.4185595661&bboxSR=26910&imageSR=26910&size=2270,1448&format=tiff&compression=None&pixelType=U8&noData=0&interpolation=RSP_NearestNeighbor&mosaicRule=%7B%22mosaicMethod%22%3A%22esriMosaicLockRaster%22%2C%22lockRasterIds%22%3A%5B3438%5D%7D&f=image'
mkdir -p samples/bush-2024/sbs && curl -fL -o samples/bush-2024/sbs/HolidayFarm_SBS_final_export_raw.tif 'https://imagery.geoplatform.gov/iipp/rest/services/Fire_Aviation/USFS_EDW_BAER_SoilBurnSeverityClassification/ImageServer/exportImage?bbox=517347.78446994728,4875154.4185595661,562747.78446994722,4904114.4185595661&bboxSR=26910&imageSR=26910&size=2270,1448&format=tiff&compression=None&pixelType=U8&interpolation=RSP_NearestNeighbor&mosaicRule=%7B%22mosaicMethod%22%3A%22esriMosaicLockRaster%22%2C%22lockRasterIds%22%3A%5B3438%5D%7D&f=image'
mkdir -p samples/bush-2024/ws && curl -fL -o samples/bush-2024/ws/hja_gauged_watersheds.geojson 'https://services1.arcgis.com/CD5mKowwN6nIaqd8/arcgis/rest/services/HJ_Andrews_Hydrology__2018_/FeatureServer/5/query?where=1%3D1&outFields=*&outSR=4326&f=geojson'
mkdir -p samples/holiday-farm && curl -fL -o samples/holiday-farm/HFF_or4417212223120200908.zip https://andrewsforest.oregonstate.edu/sites/default/files/lter/fsdbdata/gis/HFF_or4417212223120200908.zip && unzip -o samples/holiday-farm/HFF_or4417212223120200908.zip -d samples/holiday-farm/x
mkdir -p samples/bush-2024/dem && curl -fL -o samples/bush-2024/dem/ws1_ws9_dem_2m.tif 'https://elevation.nationalmap.gov/arcgis/rest/services/3DEPElevation/ImageServer/exportImage?bbox=558500,4893500,561700,4895900&bboxSR=26910&imageSR=26910&size=1600,1200&format=tiff&pixelType=F32&noData=-9999&interpolation=RSP_BilinearInterpolation&compression=None&f=image'
mkdir -p samples/hja-open/hf01301 && curl -fL -o samples/hja-open/hf01301/hf01301.zip https://andrewsforest.oregonstate.edu/sites/default/files/lter/data/studies/spatialdata/hf01301.zip && unzip -o samples/hja-open/hf01301/hf01301.zip -d samples/hja-open/hf01301/x
mkdir -p samples/hja-open/gi00601 && curl -fL -o samples/hja-open/gi00601/gi00601.zip https://andrewsforest.oregonstate.edu/sites/default/files/lter/data/studies/spatialdata/gi00601.zip && unzip -o samples/hja-open/gi00601/gi00601.zip -d samples/hja-open/gi00601/x
- Download run.json (136,872 bytes, sha256
306b3f8deeea6b0471d1c69ab30bd6684c4d2f2c3a9c6a38c8ba5b828d219f8f). - Ask your assistant to replay it with NativeGIS, or call the tool directly:
gis_replay {"action": "replay",
            "file": "<absolute path to the run.json you downloaded>",
            "inputRoot": "<your data folder>",
            "outputRoot": "<a new, empty folder>"}
Paths in the run file are relative to the data folder (inputRoot), and outputs go under outputRoot, so nothing depends on where the original run lived.
Files
- run.json: the recorded run: every call, its arguments and the numbers it returned
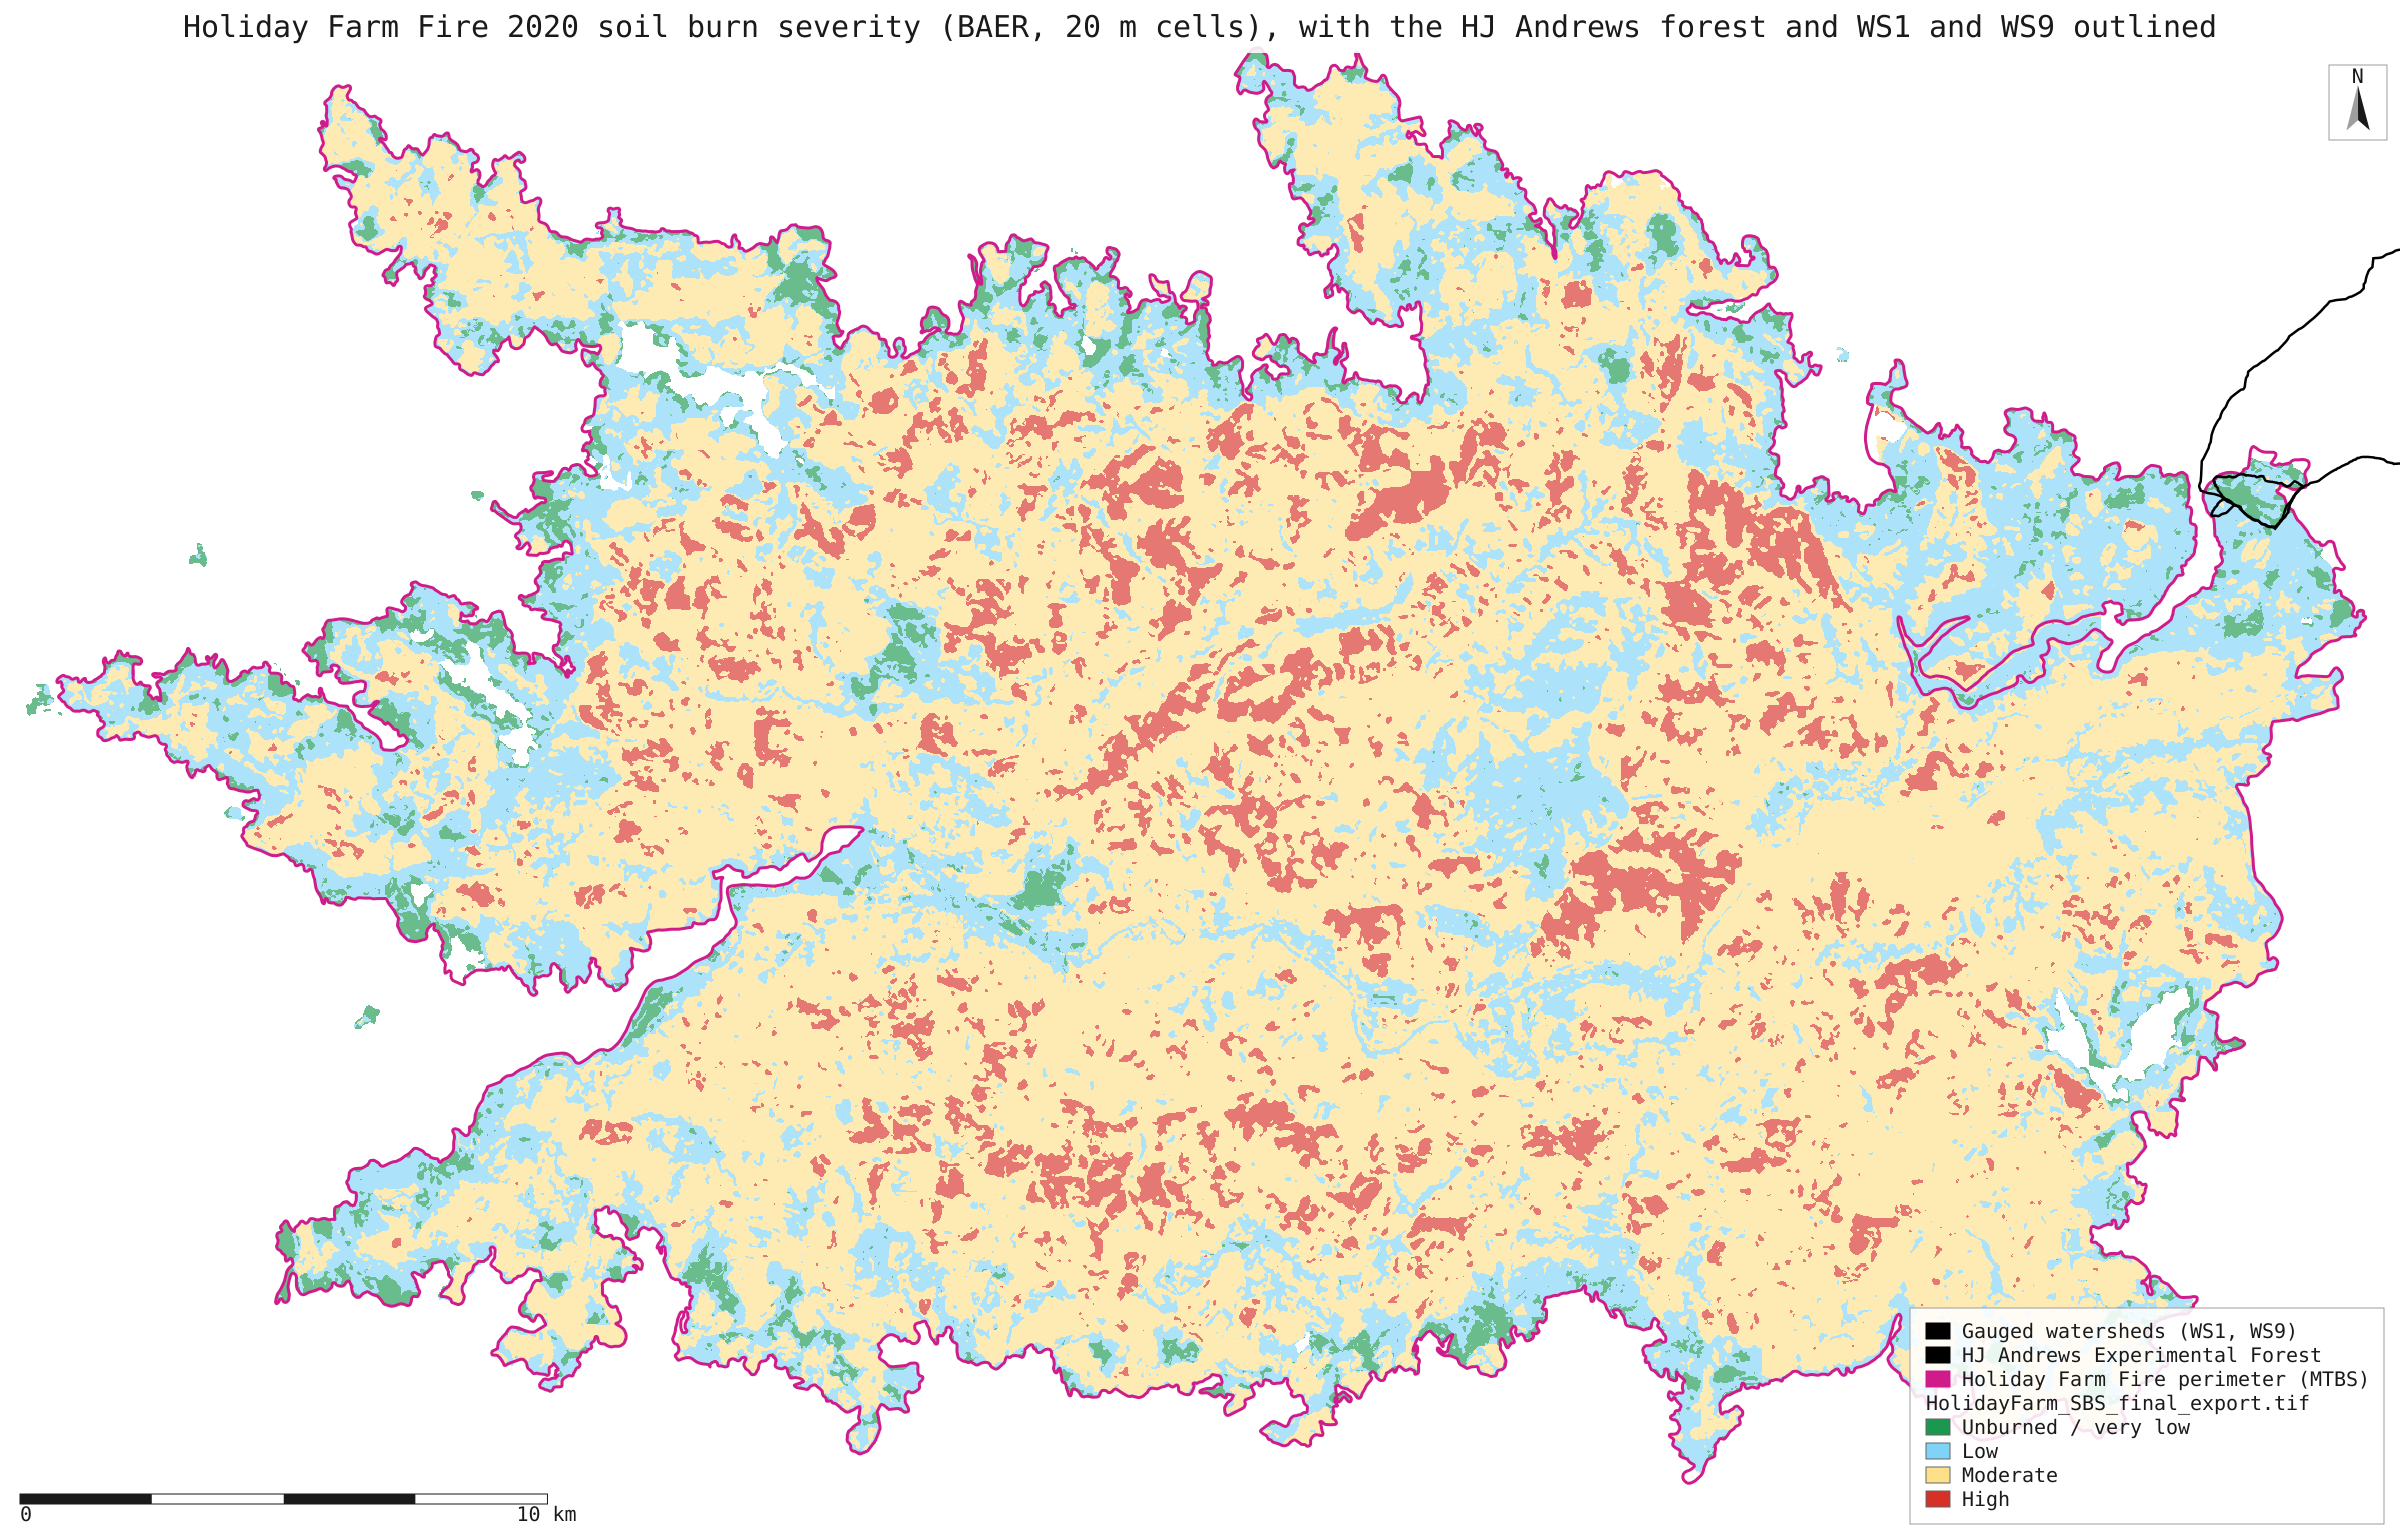
- sbs_holiday_farm.svg: map of the whole fire's soil burn severity with the two watersheds outlined at its north-east edge
- could-8-run.json: the recorded run behind "Could the published 8% be right?": every alternative product, outline, buffer and area, tallied cell by cell
Limits
- Watershed 9 is about 8 ha, which is 196 cells of 20 m. One cell is half a percent, so its shares are coarse. Cells are counted when their centre falls inside the polygon. Other clipping rules would move the small classes by a cell or two.
- The raster was exported from the US Forest Service image service on the item's own grid and extent. It was not compared byte for byte with the BAER portal's bundle, which needs an e-mail address. The whole-fire shares match the paper exactly, so it is very likely the same map.
- The watershed polygons are the 2018 HJ Andrews hydrology layer: WS1 is 97.2 ha and WS9 7.9 ha, where the paper gives 96 and 8.5 ha. The paper does not say which boundaries it used.
- The basal-area mortality half of Table 1 (Stratton 2021) is not reproduced: that dataset is not published. Only its printed rows are used, summed, as a check on the soil burn severity half.