R10 Matches except
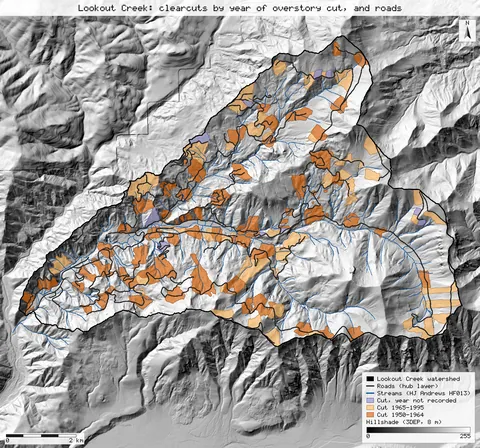
Roads and clearcuts in Lookout Creek, 1950–1995
From the open HJ Andrews layers, 13.3% of the Lookout Creek basin was cut by 1964 (published 13%), it holds 122 km of road (published 119 km), and the road right of way covers 3.9% (published 3.7%); the road construction history puts 89.9 km of road in place by 1964 (published 94 km). The harvest total comes out 2 points lower, the published 71.3% native forest is the paper's own subtraction, and the slide counts differ because only an older inventory is open.
13.3% cut by 1964 (pub. 13%); 122 km roads (pub. 119); right of way 3.9% (pub. 3.7%); slides from an older inventory · verified 2026-10-31, 69/69 steps identical
Open the study →
R14 Close
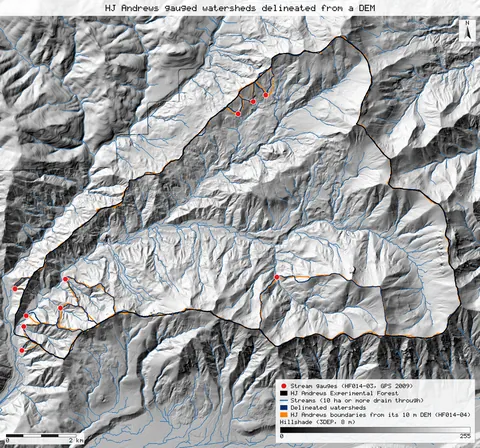
HJ Andrews gauged watersheds: areas and elevations, delineated from a terrain model
Ten gauged watersheds traced from a public terrain model and the gauges' GPS positions come back at the published areas to within 4% (Lookout Creek 6,240 ha against 6,242), and at the published gauge elevations to within 4 m.
8/10 within 2% of the published area; Lookout 6,240 ha (pub. 6,242); gauges within 4 m · verified 2026-10-31, 30/30 steps identical
Open the study →
R15 Matches except
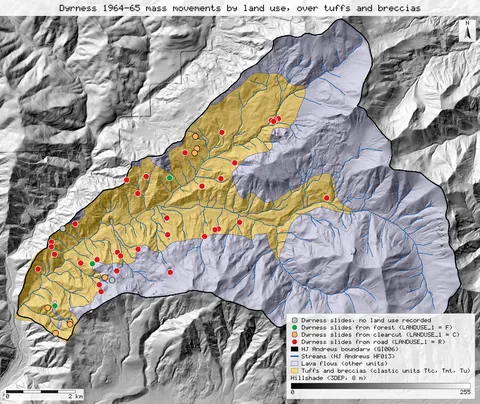
Where the 1964 storm moved the soil: roads, logging and tuff
After the December 1964 storm, Dyrness tied 72% of the Andrews' mass movements to roads and 17% to logged areas, and put 94% of them on tuffs and breccias that cover 37% of the forest. From the open slide inventory and geology map, the road share comes out 71.7%, logged areas 17.4% and the tuff and breccia share of the area 37.3%. The share of movements on tuff and breccia comes out lower, 89.1%, on the open geology map.
roads 71.7% (pub. 72%); logged 17.4% (pub. 17%); tuff area 37.3% (pub. 37%); on tuff 89.1% (pub. 94%) · verified 2026-10-31, 49/49 steps identical
Open the study →
R16 Matches except
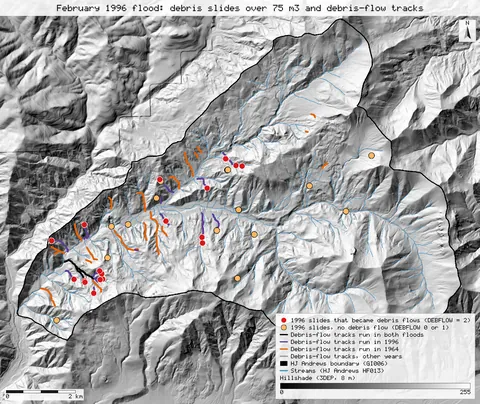
Debris slides after the February 1996 flood
The February 1996 flood started 36 debris slides larger than 75 m³ in the Andrews, against 72 after the 1964 flood. The open inventory gives exactly 36 for 1996, with the same split between roads, plantations and natural forest to within one slide. For 1964 the 2022-checked inventory gives 70 slides dated to the 1964–65 storms, against 72. 21 of the 36 slides of 1996 are flagged as becoming debris flows, against 16 published, and the open data does not resolve that difference.
36 slides in 1996 (pub. 36); 21 became debris flows (pub. 16); 70 slides in 1964 (pub. 72) · verified 2026-10-31, 81/81 steps identical
Open the study →
R18 Matches except
Where the Andrews holds its soil: the stable zone, clearcuts and roads
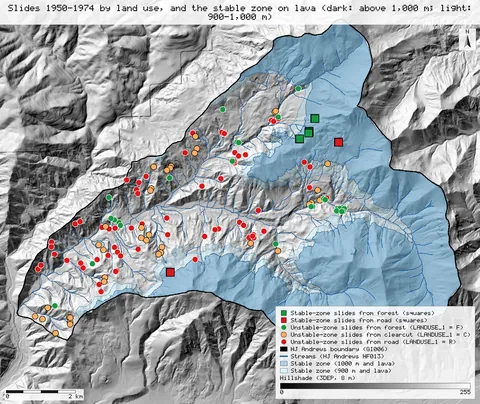
Swanson and Dyrness split the Andrews into a stable zone of 33.4 km² on lava above a contact at 900 to 1,000 m, with only two small road slides from 1950 to 1974, and an unstable zone with 139 slides, where clearcuts lost 6,130 m³/km² to landslides, 2.8 times forest, and road rights of way 30 times. With the 2022-checked open slide inventory, the stable zone is 53.4% of the forest with the contact at 900 m and 44.9% at 1,000 m, against 52.0% published; it holds exactly 2 small road slides at 1,000 m and 5 at 900 m. Over the paper's own areas the clearcut rate comes out 6,356 m³/km² and the road rate 68,669; the forest rate comes out lower, so the ratios to forest come out higher than published.
stable zone 53.4% at 900 m, 44.9% at 1,000 m (pub. 52.0%); 2 / 5 road slides in it (pub. 2); clearcut 6,356 m³/km² on the paper's area (pub. 6,130); ×4.4 / ×40 forest on our areas (pub. 2.8 / 30) · verified 2026-10-31, 120/120 steps identical
Open the study →
R19 Close Benchmark New analysis
The Lookout Creek stream network, derived from a terrain model and checked against HJ Andrews' stream maps
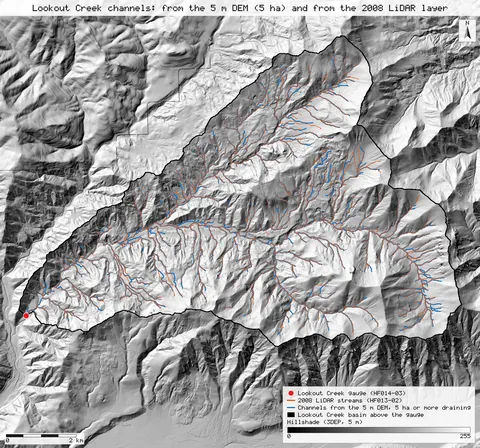
A stream network traced from a public 5 m terrain model makes Lookout Creek a 5th-order basin, as both HJ Andrews stream maps do, when channels start at 5 to 10 ha of contributing area. At the 5 ha threshold, 94% of the 2008 LiDAR map's channel length lies within 30 m of a derived channel.
5th order at 5–10 ha (pub. 5th); 93.6% of the 2008 layer within 30 m of a derived channel; density 3.53 at 5 ha against 3.27 · verified 2026-10-31, 53/53 steps identical
Open the study →
R21 Matches except
How much of the Andrews is old growth? Checking the 40% against two open maps
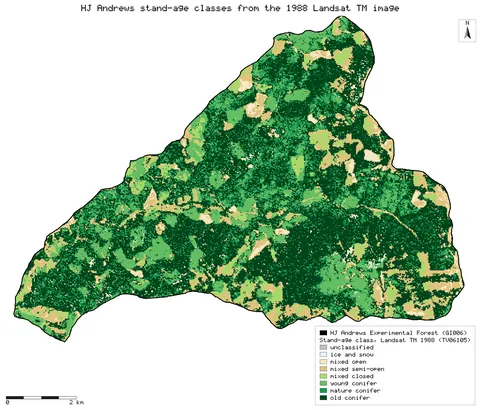
HJ Andrews says about 40% of the forest was old growth before the 2020 fires. Neither open map gives 40% inside the forest boundary: the 1988 Landsat stand-age map puts 46.1% in its old-conifer class, close to the 45% a 1984 introduction gave for trees over 400 years, while the Forest Service stand-origin map puts 30.0% in stands that began before 1600 and 59.3% in stands that began before 1800. Counted as 400 years or more by 2023 instead of by 2000, the same map gives 49.6%, so 40% falls between the two reference years.
old conifer 1988 46.1%, origin before 1600 30.0%, 1623 or earlier 49.6% (published: 40%, 1984: about 45%) · verified 2026-10-31, 170/170 steps identical
Open the study →
R22 Matches except Close
Rain gauges against an elevation-aware climate surface: how much a plain interpolation misses in the HJ Andrews mountains
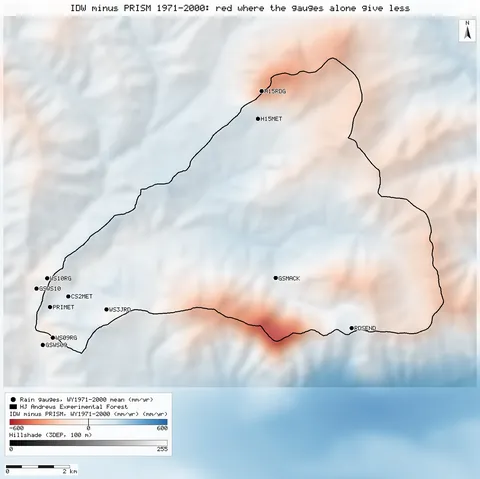
Against the PRISM grid for 1971-2000, the 13 long-record HJ Andrews gauges agree to 0.5% on average and a distance-only interpolation of them misses only 9 mm (0.4%) over the forest, though 181 mm (7.1%) above 1,300 m. The first PRISM grid, for 1980-89, puts 9.2% more rain on the forest and rises 1.10 mm per metre of elevation against 0.61: most of the 20% storage-gauge shortfall an earlier version of this page reported came from that grid.
13 gauges +0.5% vs PRISM 1971–2000 (2,297 mm/yr forest mean); IDW −181 mm above 1,300 m; first grid 2,509 mm · verified 2026-10-31, 183/183 steps identical
Open the study →
R6 Close Matches except Exact New analysis
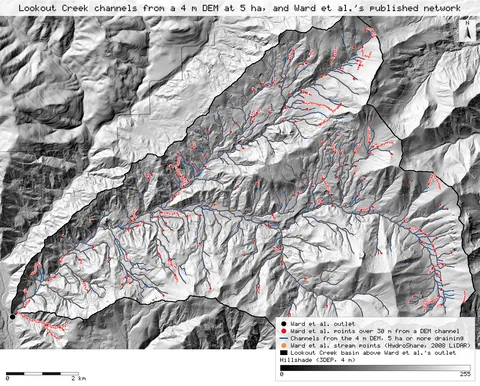
Ward et al.'s Lookout Creek river corridor network, derived again from a terrain model and checked against their published geometry
Channels traced from a public 4 m terrain model at Ward et al.'s published 5 ha threshold give 689 links and a 5th-order Lookout Creek, against their 686 segments and 5th order. 90% of their published stream points lie within 30 m of a derived channel, and 99% and more on 3rd to 5th order streams.
689 links against 686 published segments, both 5th order; 89.9% of the published points within 30 m of a derived channel · verified 2026-10-31, 56/56 steps identical
Open the study →