How much basal area did the 2023 Lookout Fire take?
The paper's 54 / 20 / 12 / 14% split comes out exactly from the RAVG map it cites, but only from that map's four-class product, whose classes are 0%, under 25%, 25–75% and 75–100% loss. Grouped into the 0–25 / 25–50 / 50–75 / 75–100% classes the paper names, the same map gives about 74 / 6 / 6 / 14%, which is RAVG's own table.
- Lowest loss class54% → 54.1% +0.1 ptsmatch
- Second class20% → 19.6% −0.4 ptsmatch
- Third class12% → 11.8% −0.2 ptsmatch
- Highest class (75–100% loss)14% → 14.4% +0.4 ptsmatch
[15]
[22]
[15]
Numbers in brackets, like [14], are step numbers in this study's run.json: the NativeGIS call that returned the figure. NativeGIS 0.3.0, recorded 2026-10-31 05:29 UTC.
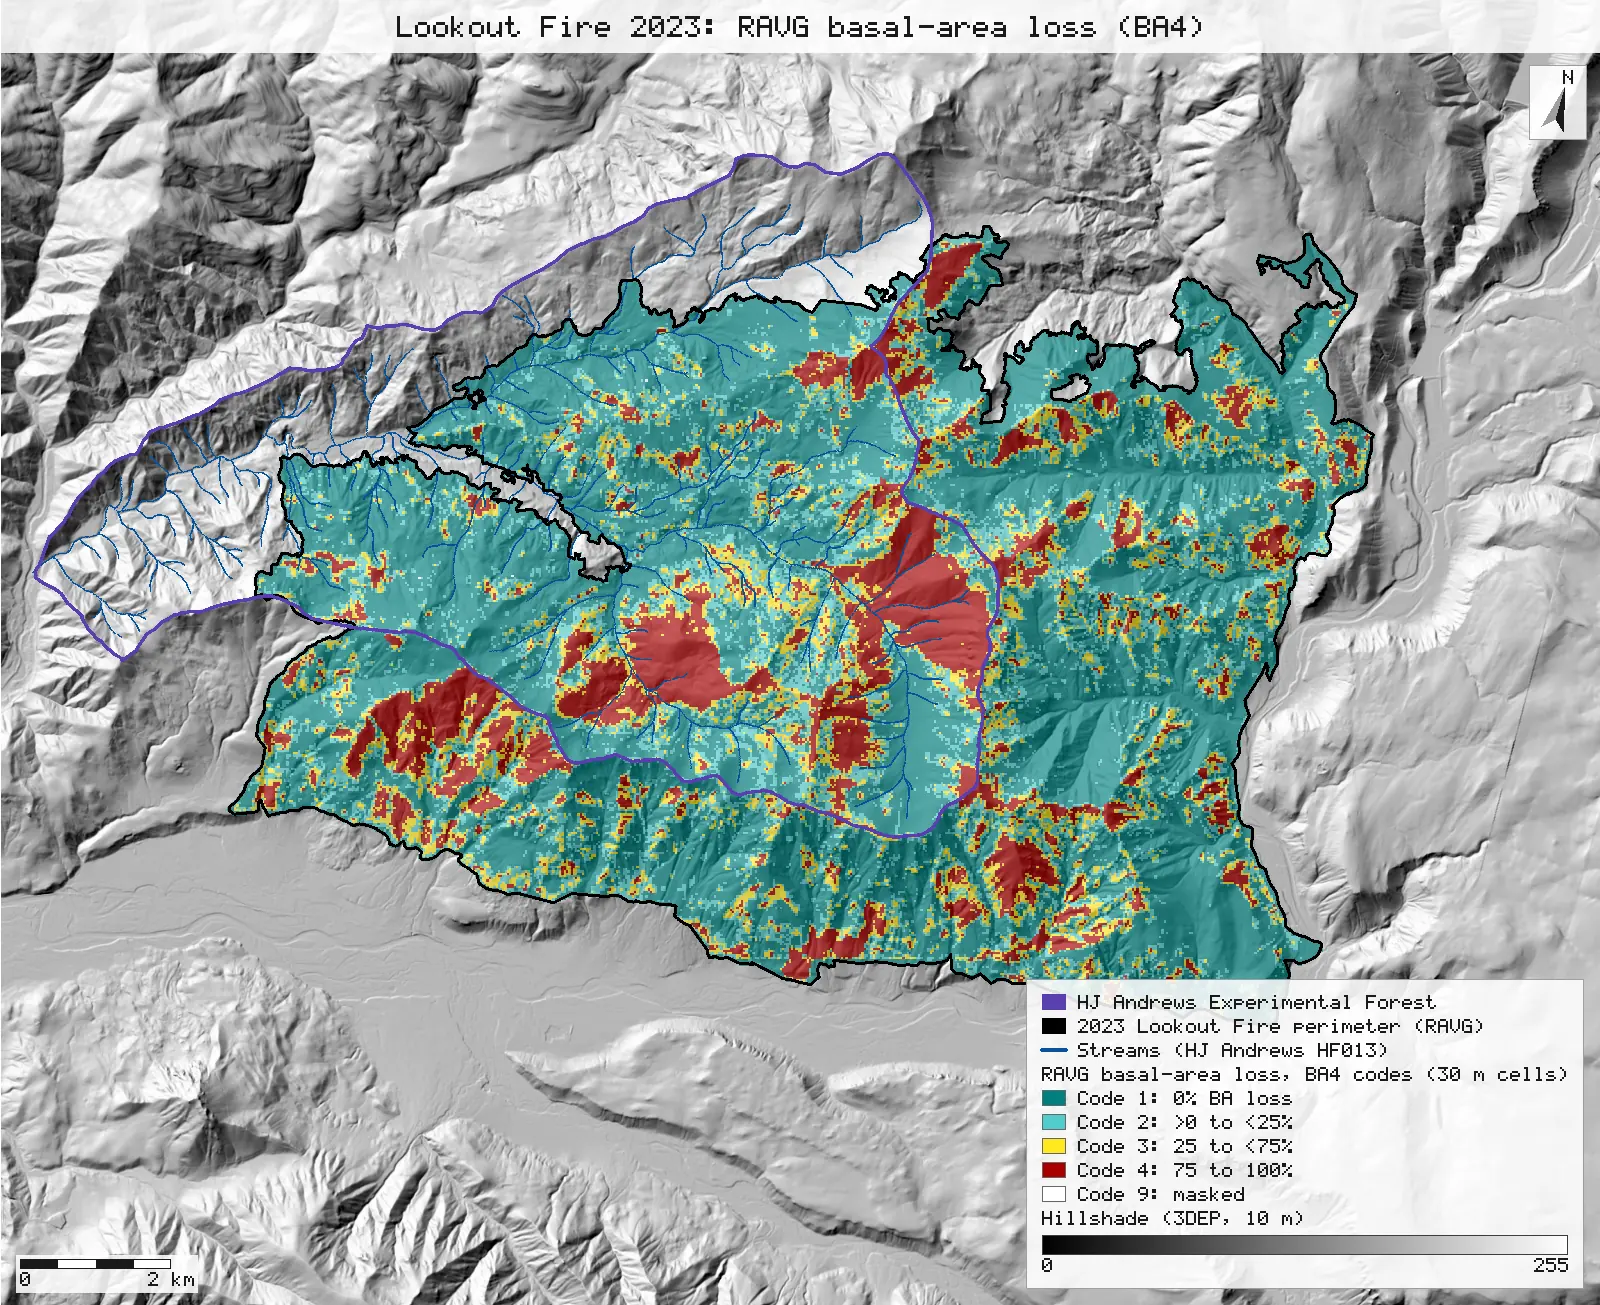
Click or tap a map to open it full screen, then zoom and pan.
What was published
Methods, Study area: RAVG's predicted basal-area loss for the Lookout Fire was mostly low (0–25%), at 54% of the footprint. Moderate (25–50%), high (50–75%) and very high (75–100%) loss covered 20, 12 and 14% of the footprint. Fig. 1 is the RAVG map, made from Sentinel images of 19 October 2022 and 19 October 2023.
Article (DOI) · RAVG program and data access · RAVG class codes (FAQ)
Published method. "We used Rapid Assessment of Vegetation Condition after Wildfire (RAVG) maps based on pre- and post-fire LANDSAT reflectance … We report expected basal area and canopy cover loss based on ranges in the Relative Differenced Normalized Burn Ratio (RdNBR)." The Fig. 1 caption names Sentinel images, and so does the RAVG bundle used here: 2022-10-19 (Sentinel-2B) and 2023-10-19 (Sentinel-2A).
The data and where it came from
All of it is open: downloaded without an account or a form.
| Data | Where | Licence |
|---|---|---|
| RAVG initial assessment for fire OR4422212214620230806 (LOOKOUT), Sentinel-2 2022-10-19 / 2023-10-19: classified BA4, BA7, CC5 and CBI4 rasters and continuous BA, CC, CBI, dNBR and RdNBR (30 m, USA Contiguous Albers, uncompressed GeoTIFF), the burn perimeter shapefile, metadata, map PDFs and RAVG's summary tables | USGS EROS / USDA Forest Service RAVG data distribution (the per-fire "Download" link of the RAVG data-access query tool), 9.7 MB zip, no form or account https://edcintl.cr.usgs.gov/downloads/sciweb1/shared/MTBS_Fire/data/ravg/data/or4422212214620230806_20221019_20231019_ravg_data.zip | US federal data, public domain |
| MTBS fire bundle for the same fire (extended assessment, Landsat 2023-07-31 / 2024-08-26): dNBR6 and perimeter, used only for the extra cross-tabulation | Re-hosted by the HJ Andrews LTER, 8.3 MB zip, no form or account https://andrewsforest.oregonstate.edu/sites/default/files/lter/fsdbdata/gis/LF_or4422212214620230806.zip | US federal data, public domain |
| HJ Andrews Experimental Forest boundary (GI006), drawn on the maps for context only | HJ Andrews LTER spatial data, zip, no form or account https://andrewsforest.oregonstate.edu/sites/default/files/lter/data/studies/spatialdata/gi00601.zip | HJ Andrews LTER data policy (open) |
| USGS 3DEP elevation, exported as a 10 m DEM (32-bit float GeoTIFF, EPSG:5070) for the Lookout Fire's window; used only for the maps' hillshade | USGS National Map 3DEP elevation image service (exportImage), no form or account; two exports gave the same sha256 https://elevation.nationalmap.gov/arcgis/rest/services/3DEPElevation/ImageServer | US federal data, public domain |
| HJ Andrews stream network (HF013, hydro.shp), NAD83 UTM zone 10N; drawn on the maps only | HJ Andrews LTER, zip, no form or account https://andrewsforest.oregonstate.edu/sites/default/files/lter/data/studies/spatialdata/hf01301.zip | HJ Andrews data policy (CC BY, acknowledgement requested) |
The input files the run read, pinned by checksum
| File (relative to the data folder) | Bytes | sha256 |
|---|---|---|
samples/ravg-lookout/x/or4422212214620230806_20221019_20231019_burn_bndy.shp | 127,828 | feae2511528e49ae… |
samples/ravg-lookout/x/or4422212214620230806_20221019_20231019_rdnbr_ba4.tif | 398,846 | fc98894ebbc087a2… |
samples/ravg-lookout/x/or4422212214620230806_20221019_20231019_rdnbr_ba7.tif | 398,846 | d35880390e7baf9c… |
samples/lookout/x/or4422212214620230806_20230731_20240826_burn_bndy.shp | 33,644 | 44058cc0c370ce97… |
samples/lookout/x/or4422212214620230806_20230731_20240826_dnbr6.tif | 398,684 | 221e116ff1ab8180… |
samples/hja-open/gi00601/x/boundary83.shp | 10,540 | 0774de0a9ebd9693… |
samples/dem3dep/lookout_fire_5070_10m.tif | 15,600,684 | 7d491709f433196d… |
samples/hja-open/hf01301/x/hydro.shp | 173,308 | 263271acd998f7bd… |
Full checksums are in run.json. Replay refuses an input whose checksum differs.
Method
- Open the RAVG BA4 and BA7 rasters (30 m grids, EPSG:5070, metres, 704 × 551 cells, no compression). Their metadata codes them as 0 = outside the perimeter, 1 to 4 or 1 to 7 = loss classes, and 9 = unmappable. NativeGIS reads the codes and counts the publisher gives. The perimeter's .prj is the non-EPSG "USA_Contiguous_Albers_Equal_Area_Conic_USGS_version", so the perimeter is opened with EPSG:5070 declared. The parameters are identical, and nothing is reprojected.
- Take the footprint as RAVG publishes it: every coded cell (code 0 set to nodata). Polygonize each class (4-connectivity), dissolve by class and measure the areas in m².
- Tally BA4 code by code. Then regroup BA7 into the classes the paper names: {1, 2, 3} = 0–25%, {4} = 25–50%, {5} = 50–75%, {6, 7} = 75–100%. Tally that too.
- Cross BA4 with BA7 cell by cell (BA4 × 10 + BA7) to see which BA7 classes each BA4 code holds.
- Sensitivity check: repeat both tallies over only the cells whose centre lies inside the RAVG perimeter polygon, and compare them with RAVG's own summary table.
- Extra (not in the paper): cross the regrouped RAVG classes with the MTBS dNBR6 severity classes, cell by cell, where both footprints overlap. The two grids share one 30 m lattice, offset by exactly one cell.
- Render both class maps as SVG, the classes as 30 m cells at 65% opacity over a hillshade of a 10 m USGS 3DEP DEM, with the perimeter, the HJ Andrews boundary and its streams.
The run made 54 NativeGIS calls: gis_open × 8, gis_query × 7, gis_process × 33, gis_info × 2, gis_render × 4.
Published numbers next to ours
The published split against the RAVG map
| Paper's class (basal-area loss) | Published | RAVG BA4 code | BA4 ha | BA4 share | BA7 regrouped ha | BA7 regrouped share |
|---|---|---|---|---|---|---|
| 0–25% (low) | 54% | Code 1: 0% | 5,716 | 54.1% | 7,787 | 73.7% |
| 25–50% (moderate) | 20% | Code 2: >0 to <25% | 2,071 | 19.6% | 657 | 6.2% |
| 50–75% (high) | 12% | Code 3: 25 to <75% | 1,251 | 11.8% | 594 | 5.6% |
| 75–100% (very high) | 14% | Code 4: 75 to 100% | 1,522 | 14.4% | 1,522 | 14.4% |
| Total with a loss class | 100% | 10,560 | 100% | 10,560 | 100% |
Method: every coded cell of the RAVG raster (code 0, outside the fire, set to nodata), polygonized (4-connectivity), dissolved by class and measured [8, 10, 11, 13, 15]. BA7 was regrouped {1,2,3}, {4}, {5}, {6,7} [16, 22]. Units: m² on the 30 m grid (900 m² a cell) in EPSG:5070 (equal-area Albers), shown as hectares. Shares are of the cells with a loss class. n = 117,337 cells. 4 masked cells (code 9) are left out.
What each BA4 code holds, cell by cell
| BA4 code (RAVG definition) | BA7 classes inside it | Cells |
|---|---|---|
| 1: 0% | 1 (0%) | 63,514 |
| 2: >0 to <25% | 2 (>0 to <10%) 3 (10 to <25%) | 16,198 6,813 |
| 3: 25 to <75% | 4 (25 to <50%) 5 (50 to <75%) | 7,302 6,601 |
| 4: 75 to 100% | 6 (75 to <90%) 7 (90 to 100%) | 4,271 12,638 |
Raster calculation BA4 × 10 + BA7, polygonized, dissolved and measured [23, 29]. No other pairs occur. Code 3 holds both 25–50% and 50–75% loss, so it cannot be the paper's "25–50%" class.
Inside the perimeter polygon, and RAVG's own table
| Class | BA4 share | BA7 regrouped (ac) | RAVG table (ac) | BA7 regrouped share | RAVG table share |
|---|---|---|---|---|---|
| 0–25% | 53.6% | 18,891 | 18,887 | 73.4% | 73.4% |
| 25–50% | 19.8% | 1,623 | 1,623 | 6.3% | 6.3% |
| 50–75% | 12.0% | 1,467 | 1,467 | 5.7% | 5.7% |
| 75–100% | 14.6% | 3,760 | 3,761 | 14.6% | 14.6% |
Method: the same tallies over cells whose centre lies inside the RAVG perimeter [30, 36, 37, 43]. n = 115,746 cells. The polygon measures 25,739 ac [3] and its BurnBndAc attribute reads 25,739 ac [2]. RAVG's table totals 25,739 ac. RAVG's own summary for this fire ("RAVG Table (BA)" in or4422212214620230806_20221019_20231019_ravg_tables.xlsx, in the same download), summed over vegetation groups and ownership. Its classes are labelled 0–25 / 25–50 / 50–75 / 75–100%, and they agree with BA7 regrouped, not with BA4.
Extra: RAVG classes against MTBS severity, cell by cell
| RAVG (BA7 regrouped) | MTBS unburned to low | MTBS low | MTBS moderate | MTBS high | MTBS increased greenness | Cells |
|---|---|---|---|---|---|---|
| 0–25% | 23.9% | 49.2% | 22.6% | 4.3% | 0.1% | 81,637 |
| 25–50% | 1.0% | 11.5% | 44.1% | 43.3% | 0.1% | 7,292 |
| 50–75% | 0.5% | 5.4% | 27.6% | 66.4% | 0.0% | 6,598 |
| 75–100% | 0.2% | 2.7% | 9.6% | 87.5% | 0.0% | 16,905 |
Method: MTBS dNBR6 clipped to the MTBS perimeter [46], then the raster calculation RAVG class × 10 + dNBR6 on RAVG's grid (the MTBS grid is the same 30 m lattice, offset by one cell; nearest-cell lookup) [47], polygonized, dissolved and measured [53]. Row shares. n = 112,432 cells where both products have a class. This comparison is not in the paper.
Why any numbers differ
- The percentages match, but the class labels do not. The four RAVG BA4 codes cover 54.1, 19.6, 11.8 and 14.4% of the footprint. Rounded, that is the paper's 54 / 20 / 12 / 14. RAVG defines those codes as 0% loss, more than 0 but under 25%, 25 to under 75%, and 75 to 100% (RAVG FAQ and the bundle's metadata). The paper calls them 0–25, 25–50, 50–75 and 75–100%. Those are the labels of RAVG's equal-interval PDF map legend, not of the BA4 raster. The cell-by-cell cross of BA4 with BA7 confirms the nesting: BA4 code 3 is BA7 classes 4 and 5 together (25–50% and 50–75%).
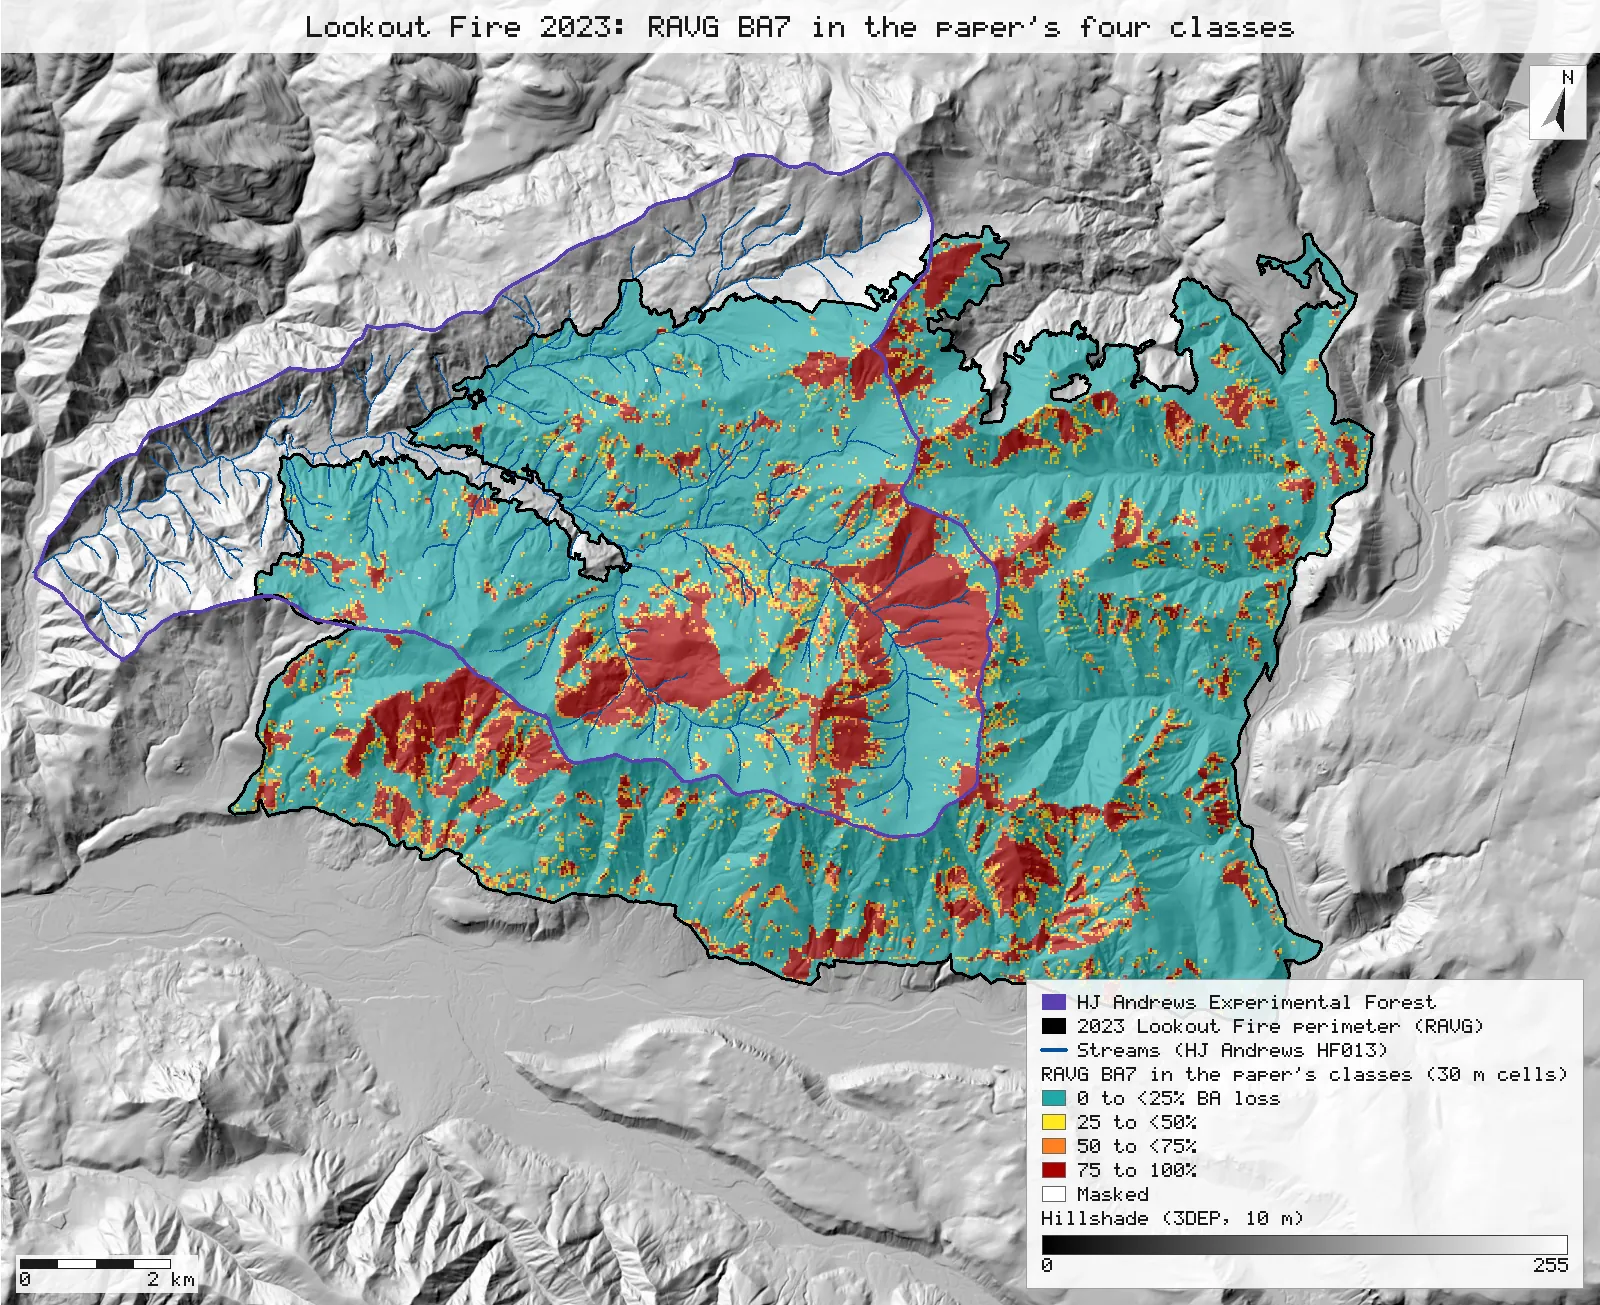
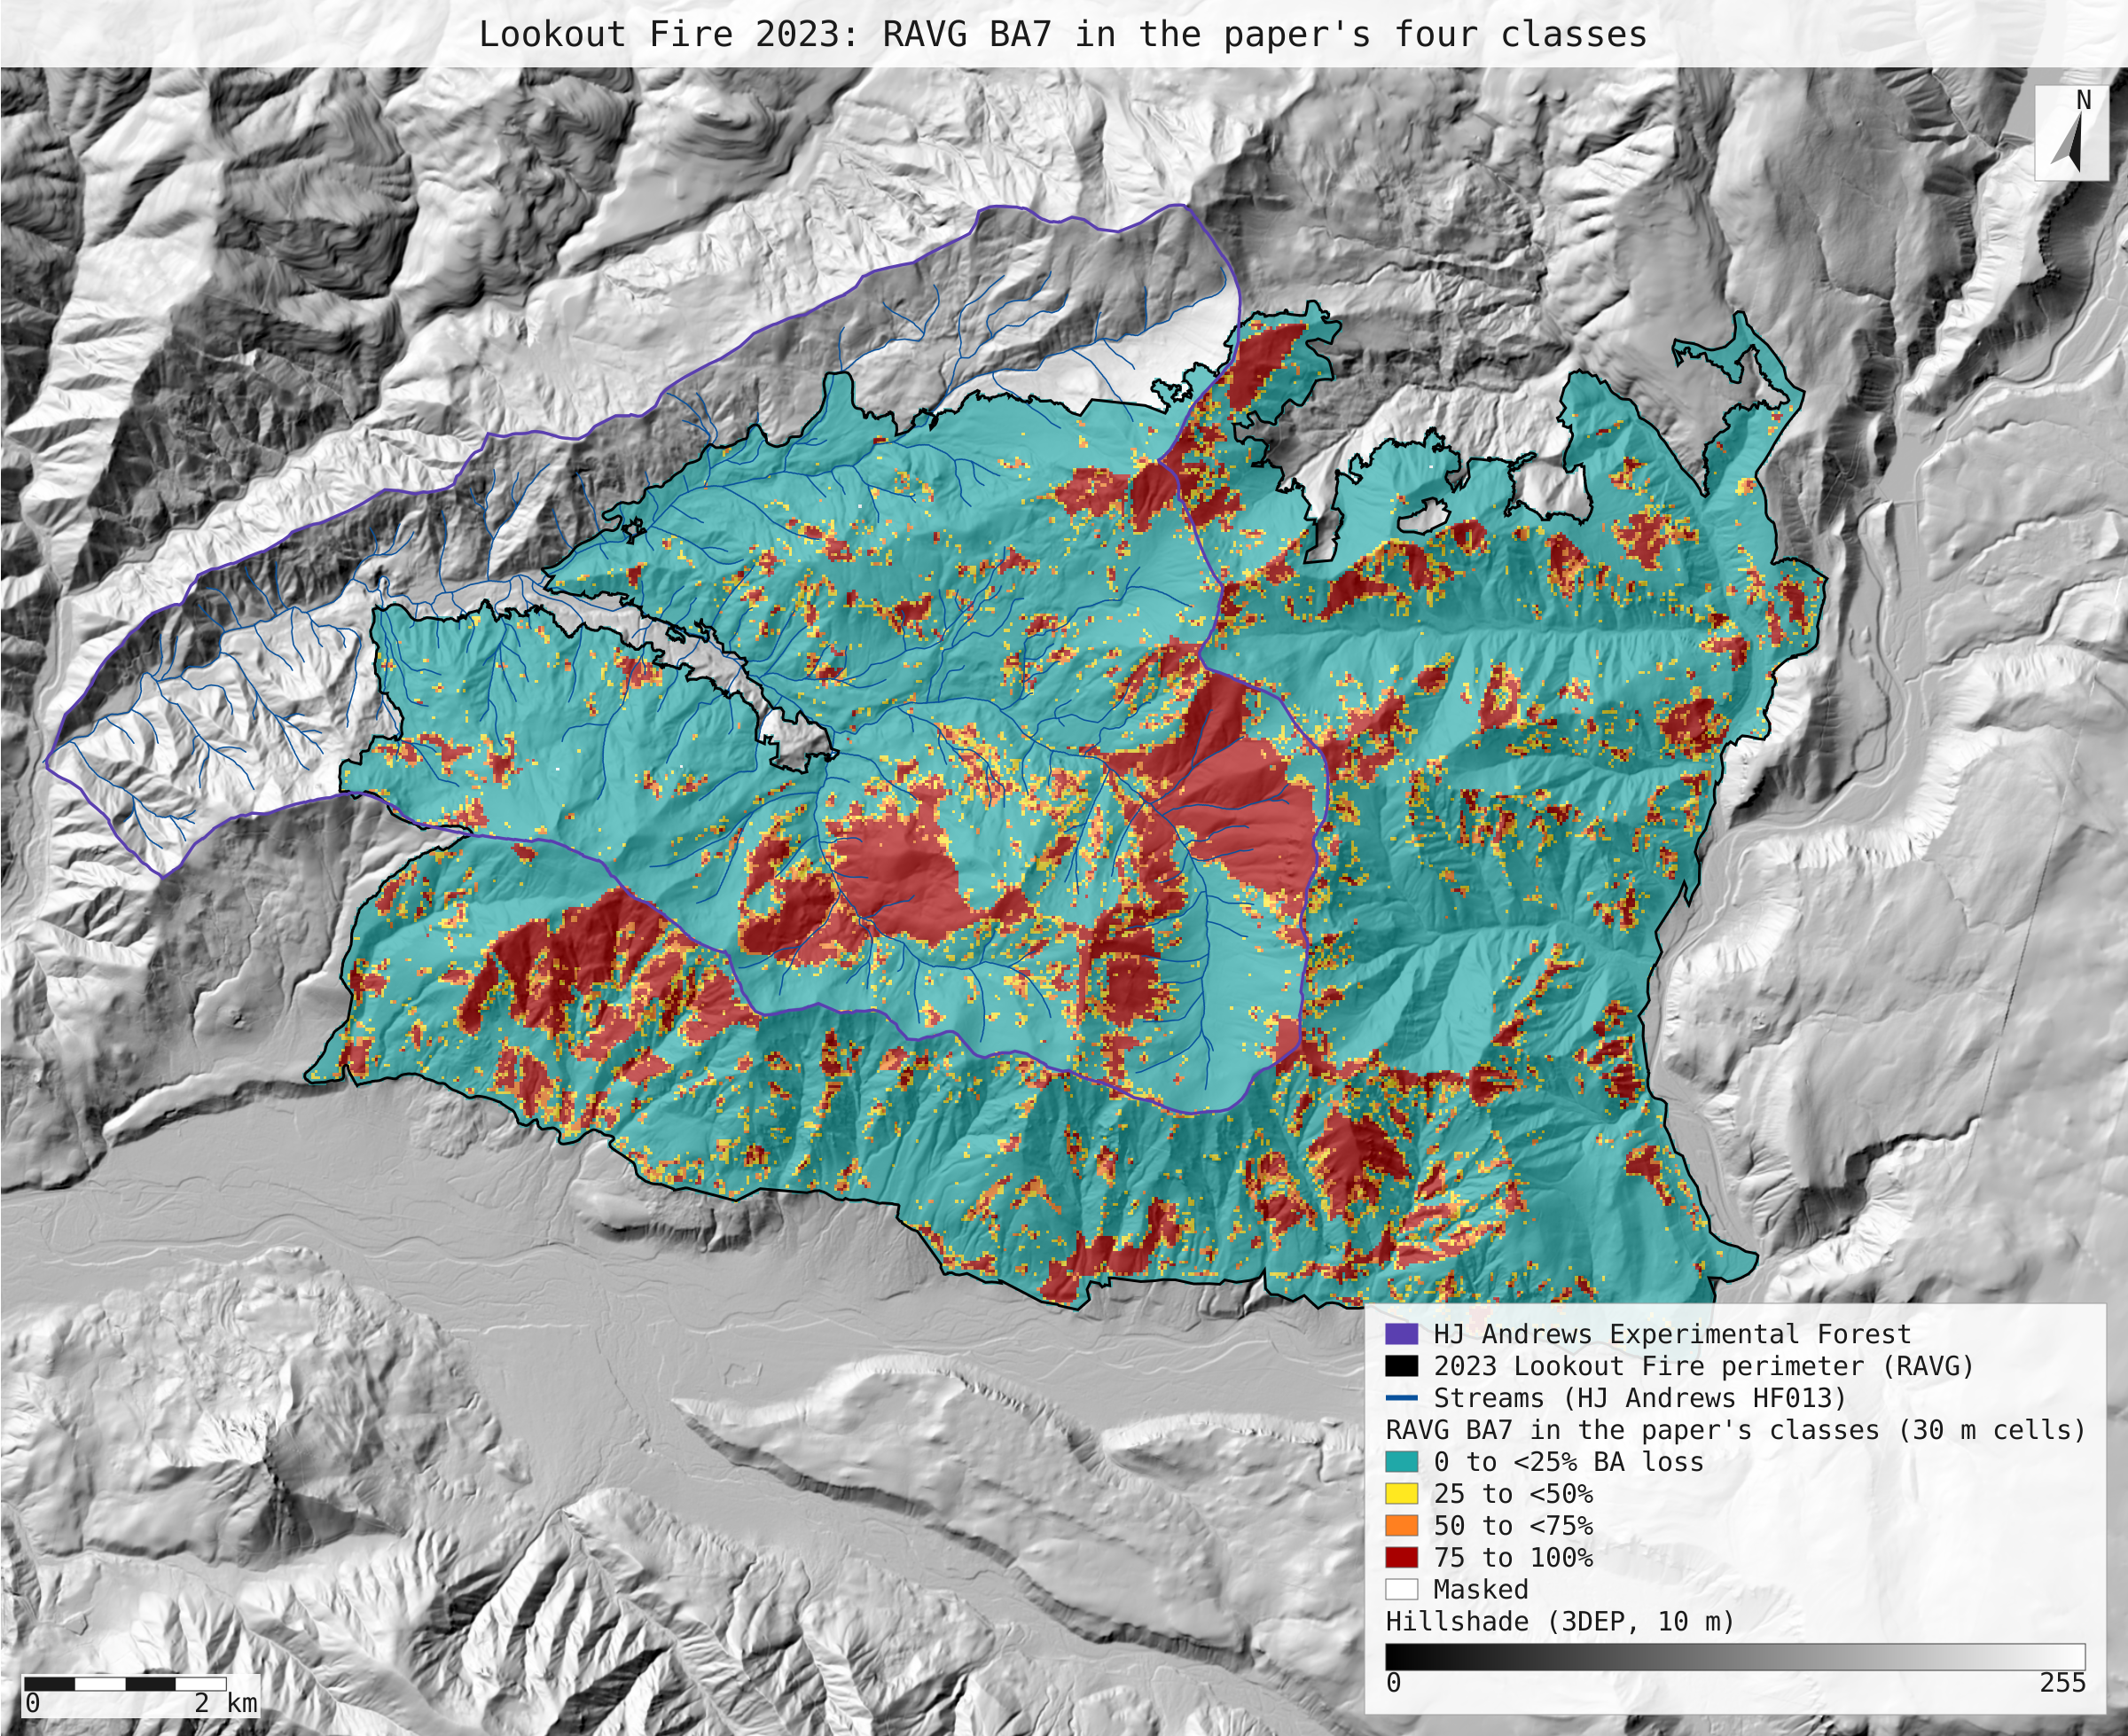
- With the paper's own class bounds, the split is about 74 / 6 / 6 / 14. Grouping BA7 into 0–25, 25–50, 50–75 and 75–100% loss gives 73.7, 6.2, 5.6 and 14.4% over RAVG's footprint. Inside the perimeter polygon it gives 73.4, 6.3, 5.7 and 14.6%, which is RAVG's own summary table to within a few acres. By RAVG's own class definitions, the 54% the paper labels 0–25% is the area with no predicted basal-area loss, and the next 20% is the area with some loss under 25%.
- Which footprint matters, but only a little. RAVG's raster codes 1,591 more cells than the centre-in-polygon perimeter clip keeps, mostly along the edge. Over the perimeter clip the BA4 split is 53.6 / 19.8 / 12.0 / 14.6, so the last class rounds to 15 rather than 14. The paper's figures match the raster as RAVG distributes it.
- Extra: RAVG against MTBS. Where both maps cover the fire, about 87% of RAVG's 75–100% loss cells are MTBS high severity. Most of RAVG's 0–25% cells are MTBS low (about 49%) or moderate (about 23%), not unburned-to-low. The two products differ in image dates (RAVG October 2023, about a month after the fire; MTBS August 2024, a year after), sensors and index (RdNBR model against dNBR thresholds), so this is a comparison, not a check of either.
Replay it yourself
The run file records every call, its arguments, the checksums of the files it read and the numbers it returned. Replaying it repeats every call in a fresh NativeGIS session and checks that each answer comes out the same.
- Make an empty data folder and fetch the inputs into it exactly as below (bash; the folder layout is the one the run file expects):
cd /path/to/an/empty/folder
mkdir -p samples/ravg-lookout && curl -fL -o samples/ravg-lookout/or4422212214620230806_20221019_20231019_ravg_data.zip https://edcintl.cr.usgs.gov/downloads/sciweb1/shared/MTBS_Fire/data/ravg/data/or4422212214620230806_20221019_20231019_ravg_data.zip && unzip -o samples/ravg-lookout/or4422212214620230806_20221019_20231019_ravg_data.zip -d samples/ravg-lookout/x
mkdir -p samples/lookout && curl -fL -o samples/lookout/LF_or4422212214620230806.zip https://andrewsforest.oregonstate.edu/sites/default/files/lter/fsdbdata/gis/LF_or4422212214620230806.zip && unzip -o samples/lookout/LF_or4422212214620230806.zip -d samples/lookout/x
mkdir -p samples/hja-open/gi00601 && curl -fL -o samples/hja-open/gi00601/gi00601.zip https://andrewsforest.oregonstate.edu/sites/default/files/lter/data/studies/spatialdata/gi00601.zip && unzip -o samples/hja-open/gi00601/gi00601.zip -d samples/hja-open/gi00601/x
mkdir -p samples/dem3dep && curl -fL -o samples/dem3dep/lookout_fire_5070_10m.tif 'https://elevation.nationalmap.gov/arcgis/rest/services/3DEPElevation/ImageServer/exportImage?bbox=-2066300,2634800,-2045100,2652200&bboxSR=5070&imageSR=5070&size=2120,1740&format=tiff&pixelType=F32&noData=-9999&interpolation=RSP_BilinearInterpolation&compression=None&f=image'
mkdir -p samples/hja-open/hf01301 && curl -fL -o samples/hja-open/hf01301/hf01301.zip https://andrewsforest.oregonstate.edu/sites/default/files/lter/data/studies/spatialdata/hf01301.zip && unzip -o samples/hja-open/hf01301/hf01301.zip -d samples/hja-open/hf01301/x
- Download run.json (108,923 bytes, sha256
4800bace1a78b404d0af5f9d7deded4809a94b02eeee1ea0252bafb0eff6357b). - Ask your assistant to replay it with NativeGIS, or call the tool directly:
gis_replay {"action": "replay",
            "file": "<absolute path to the run.json you downloaded>",
            "inputRoot": "<your data folder>",
            "outputRoot": "<a new, empty folder>"}
Paths in the run file are relative to the data folder (inputRoot), and outputs go under outputRoot, so nothing depends on where the original run lived.
Files
- run.json: the recorded run: every call, its arguments and the numbers it returned
- ravg_paper_classes.svg: map: the same fire with BA7 grouped into the paper's stated classes, over the same 10 m 3DEP hillshade
Limits
- This checks a published tally against open data. It does not test the science: RAVG's basal-area loss is a model prediction from satellite imagery, and the paper's own plots found more loss after winter.
- Percentages are shares of the cells with a loss class (codes 1 to 4). The 4 masked cells (code 9, 3,600 m²) are left out of the denominator. Including them would change no share by more than 0.004 percentage points.
- The paper says Landsat in Methods and Sentinel in the Fig. 1 caption. The RAVG bundle that matches the fire, its dates and the published numbers is the Sentinel-2 one, so that is the product used here. No other RAVG assessment of this fire was found on the portal.
- The paper's plot-level basal-area figures (2% immediate loss, 9% after winter) come from field plots that are not public, so they are not reproduced.
- NativeGIS gaps this run hit: the perimeter's non-EPSG CRS name had to be declared (NGISB-6, as on R1); gis_render cannot set a legend label for a layer, so the layers were given readable dataset names instead; there is still no one-call table of area per raster class (NGISF-50), so areas go through polygonize, dissolve and measure.