Where the 1964 storm moved the soil: roads, logging and tuff
After the December 1964 storm, Dyrness tied 72% of the Andrews' mass movements to roads and 17% to logged areas, and put 94% of them on tuffs and breccias that cover 37% of the forest. From the open slide inventory and geology map, the road share comes out 71.7%, logged areas 17.4% and the tuff and breccia share of the area 37.3%. The share of movements on tuff and breccia comes out lower, 89.1%, on the open geology map.
- In connection with roads72% → 71.7% −0.3 ptsmatch
- In logged areas17% → 17.4% +0.4 ptsmatch
- Area on tuff and breccia37% → 37.3% +0.3 ptsmatch
- Movements on tuff and breccia94% → 89.1% −4.9 ptsexplained why
[23, 19]
[12, 4]
[30, 31]
Numbers in brackets, like [14], are step numbers in this study's run.json: the NativeGIS call that returned the figure. NativeGIS 0.3.0, recorded 2026-10-31 07:28 UTC.
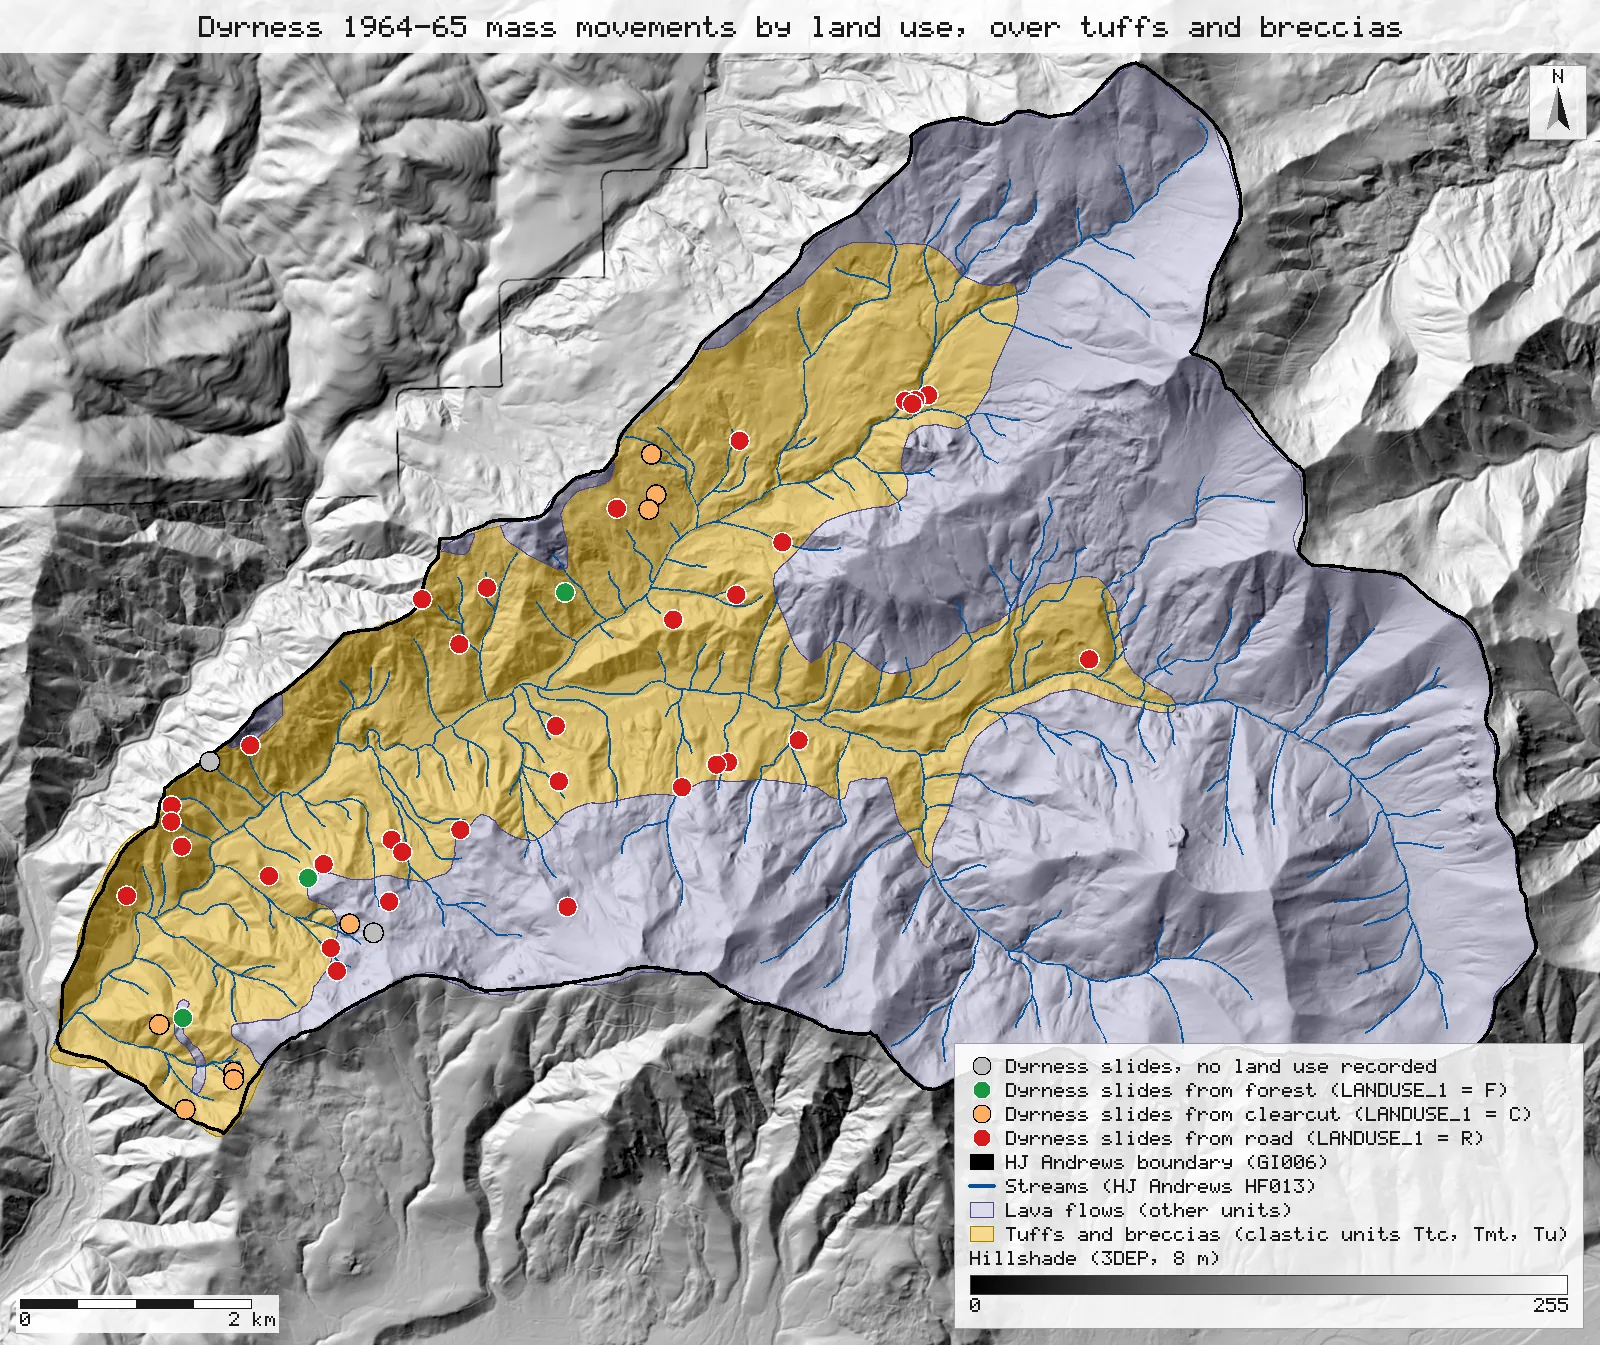
Click or tap a map to open it full screen, then zoom and pan.
What was published
After the storm of December 1964, Dyrness surveyed every mass soil movement of 100 cubic yards or more in the Andrews (April to July 1965) and described 47 events. The abstract and discussion give the headline shares: about 72 percent of the movements occurred "in connection with roads" and 17 percent in logged areas (the text counts eight events in logged areas and five in undisturbed forest), and about 94 percent occurred where the substratum is tuff and/or breccia, "even though only 37 percent of the total area is made up of these rocks". The discussion adds that 6.4 percent of the events were on basalt and andesite, which underlie about 63 percent of the area, and that 64 percent were on greenish tuffs and breccias covering 8 percent.
Andrews Forest catalogue entry · Scanned report (PDF) · Full text, second scan (Internet Archive, PDF)
Published method. A field survey of the whole Experimental Forest from April to July 1965, recording each event's type, size, land use and site factors, including the substratum in the movement area (Table 3).
The data and where it came from
All of it is open: downloaded without an account or a form.
| Data | Where | Licence |
|---|---|---|
| GE012 landslide inventory 1953–1996 (slide_inv_all2.shp, NAD83 / UTM 10N). Dyrness's 1964–65 survey is the subset INV = D; LANDUSE_1 is the land use at the origin (R road, C cut, F forest) | HJ Andrews LTER, 202 kB zip, no form or account https://andrewsforest.oregonstate.edu/sites/default/files/lter/data/studies/spatialdata/ge01201.zip | CC BY 4.0 (EDI record for GE012) |
| GE009 geology of the Andrews (geology.shp, NAD83 / UTM 10N): the upper Blue River rock units after Priest et al. (1988) and Walker & Duncan (1989), clipped to the Andrews; UNIT and a rock STRENGTH code | HJ Andrews LTER, 205 kB zip, no form or account https://andrewsforest.oregonstate.edu/sites/default/files/lter/data/studies/spatialdata/ge00901.zip | HJ Andrews data policy (CC BY, acknowledgement requested) |
| GI006 HJ Andrews Experimental Forest boundary (boundary83.shp) | HJ Andrews LTER, zip, no form or account https://andrewsforest.oregonstate.edu/sites/default/files/lter/data/studies/spatialdata/gi00601.zip | HJ Andrews data policy (CC BY, acknowledgement requested) |
| USGS 3DEP elevation, exported as an 8 m DEM (32-bit float GeoTIFF, NAD83 UTM zone 10N) for the map window; used only for the map's hillshade | USGS National Map 3DEP elevation image service (exportImage), no form or account https://elevation.nationalmap.gov/arcgis/rest/services/3DEPElevation/ImageServer | US federal data, public domain |
| HJ Andrews stream network (HF013, hydro.shp), NAD83 UTM zone 10N; drawn on the map only | HJ Andrews LTER, zip, no form or account https://andrewsforest.oregonstate.edu/sites/default/files/lter/data/studies/spatialdata/hf01301.zip | HJ Andrews data policy (CC BY, acknowledgement requested) |
The input files the run read, pinned by checksum
| File (relative to the data folder) | Bytes | sha256 |
|---|---|---|
samples/hja-open/gi00601/x/boundary83.shp | 10,540 | 0774de0a9ebd9693… |
samples/hja-open/ge00901/x/geology.shp | 31,040 | 8380a806b8970f0f… |
samples/hja-open/ge01201/x/slide_inv_all2.shp | 9,480 | 876220d16d25c000… |
samples/dem3dep/lookout_creek_26910_8m.tif | 11,930,186 | de869b30bf1a2161… |
samples/hja-open/hf01301/x/hydro.shp | 173,308 | 263271acd998f7bd… |
Full checksums are in run.json. Replay refuses an input whose checksum differs.
Method
- Open the GE012 inventory, select Dyrness's points (INV = D) and keep those inside the Andrews boundary. Count them by LANDUSE_1: R road, C cut (logged), F forest, and no value.
- Tuff and breccia, defined from the GE009 metadata: its rock-unit correlation table lists Ttc ("clastics", 18–25 million years), Tmt ("clastics, especially ashflows", about 14 million years) and Tu (Walker & Duncan's name for the same clastics) as the clastic units; every other unit is a lava flow or an intrusion. The layer's STRENGTH code splits the same way (clastics weak or moderate, lavas strong). Dissolve the clastic units and the whole map and measure both areas.
- Join each Dyrness point to the geology polygon it lies within (a point-in-polygon spatial join) and count the points on the clastic units. For the points on lava, find the distance to the nearest clastic polygon.
- Render the map as SVG over a hillshade of an 8 m USGS 3DEP DEM, with the HJ Andrews streams; record the run and replay it in a fresh session.
The run made 49 NativeGIS calls: gis_open × 5, gis_process × 18, gis_query × 23, gis_close × 1, gis_render × 2.
Published numbers next to ours
| Measure | Published | NativeGIS | How NativeGIS got it |
|---|---|---|---|
| Mass movements | 47 events | 46 points | GE012 points with INV = D inside the boundary [19]; 2 carry no year, land use or volume [20], the other 44 are 76 m³ (100 yd³) or larger [21] |
| In connection with roads | about 72% | 71.7% 33 of 46 | LANDUSE_1 = R [23] |
| In logged areas | 17% 8 events | 17.4% 8 of 46 | LANDUSE_1 = C [25] |
| In undisturbed forest | about 11% 5 events | 6.5% 3 of 46 | LANDUSE_1 = F [27]; 2 more have no land use [29] |
| Area on tuff and breccia | 37% | 37.3% 23.69 of 63.54 km² | Clastic units Ttc 10.87 km², Tmt 12.83 km², Tu 67 m² [6, 8, 10], dissolved [12], over the whole map [4]. Clipped to the boundary: 37.3% [15, 16] |
| Movements on tuff and breccia | about 94% | 89.1% 41 of 46 | Point-in-polygon join with GE009 [30, 31]: Ttc 23, Tmt 18, Tu 0 [36, 37, 38]. Points with a year: 40 of 44, 90.9% [34, 35] |
| Movements on basalt and andesite | 6.4% | 10.9% 5 of 46 | [32]; 79 to 639 m from the nearest clastic polygon (79, 106, 217, 311, 639 m) [40, 41] |
Units: counts of inventory points and m² in NAD83 / UTM zone 10N (EPSG:26910), reported as % and km². Area: the GE009 map covers 63.54 km² [4]; the GI006 boundary polygon 63.69 km² [2]. Of the road-related movements, 30 of 33 lie on the clastic units [42].
Why any numbers differ
- The road and logged shares match. 33 of the 46 Dyrness points carry LANDUSE_1 = R (71.7%) and 8 carry C (17.4%), against "about 72" and 17 percent. The paper counts 47 events; the inventory holds 46 points, two of them with no year, land use or volume, so the open file is one event short and does not say which.
- The tuff and breccia share of the area matches. The clastic units cover 37.3% of the mapped geology (37.3% again after clipping to the boundary), against 37 percent.
- The share of movements on tuff and breccia comes out lower on the map, and the paper's own field figures say why. 41 of the 46 points lie on the clastic units (89.1%), against about 94 percent; leaving out the two points with no record gives 40 of 44 (90.9%). The full text puts 6.4 percent of the 47 events on basalt and andesite, which is 3 events, so 44 of 47 (93.6%) were on tuff and breccia by the substratum Dyrness recorded in the field at each event. The open map puts 5 points on lava, 2 more than the field record, at 79 to 639 m from the nearest clastic contact. The map is a 1991 compilation at 1:62,500 to 1:250,000, so a small slide near a contact, or on a tuff lens too small to map, can fall on the lava side: the gap is field geology against map geology.
- Not checked: the 64 percent on greenish tuffs and breccias (8 percent of the area). GE009 does not separate greenish from reddish tuffs.
Replay it yourself
The run file records every call, its arguments, the checksums of the files it read and the numbers it returned. Replaying it repeats every call in a fresh NativeGIS session and checks that each answer comes out the same.
- Make an empty data folder and fetch the inputs into it exactly as below (bash; the folder layout is the one the run file expects):
cd /path/to/an/empty/folder
mkdir -p samples/hja-open/ge01201 && curl -fL -o samples/hja-open/ge01201/ge01201.zip https://andrewsforest.oregonstate.edu/sites/default/files/lter/data/studies/spatialdata/ge01201.zip && unzip -o samples/hja-open/ge01201/ge01201.zip -d samples/hja-open/ge01201/x
mkdir -p samples/hja-open/ge00901 && curl -fL -o samples/hja-open/ge00901/ge00901.zip https://andrewsforest.oregonstate.edu/sites/default/files/lter/data/studies/spatialdata/ge00901.zip && unzip -o samples/hja-open/ge00901/ge00901.zip -d samples/hja-open/ge00901/x
mkdir -p samples/hja-open/gi00601 && curl -fL -o samples/hja-open/gi00601/gi00601.zip https://andrewsforest.oregonstate.edu/sites/default/files/lter/data/studies/spatialdata/gi00601.zip && unzip -o samples/hja-open/gi00601/gi00601.zip -d samples/hja-open/gi00601/x
mkdir -p samples/dem3dep && curl -fL -o samples/dem3dep/lookout_creek_26910_8m.tif 'https://elevation.nationalmap.gov/arcgis/rest/services/3DEPElevation/ImageServer/exportImage?bbox=558400,4891600,572400,4904600&bboxSR=26910&imageSR=26910&size=1750,1625&format=tiff&pixelType=F32&noData=-9999&interpolation=RSP_BilinearInterpolation&compression=None&f=image'
mkdir -p samples/hja-open/hf01301 && curl -fL -o samples/hja-open/hf01301/hf01301.zip https://andrewsforest.oregonstate.edu/sites/default/files/lter/data/studies/spatialdata/hf01301.zip && unzip -o samples/hja-open/hf01301/hf01301.zip -d samples/hja-open/hf01301/x
- Download run.json (71,508 bytes, sha256
ecbf4e9017db255d3c80b81b2cdaa49457ccd41a84da8533f0c9e6d5424d6832). - Ask your assistant to replay it with NativeGIS, or call the tool directly:
gis_replay {"action": "replay",
            "file": "<absolute path to the run.json you downloaded>",
            "inputRoot": "<your data folder>",
            "outputRoot": "<a new, empty folder>"}
Paths in the run file are relative to the data folder (inputRoot), and outputs go under outputRoot, so nothing depends on where the original run lived.
Files
- run.json: the recorded run: every call, its arguments and the numbers it returned
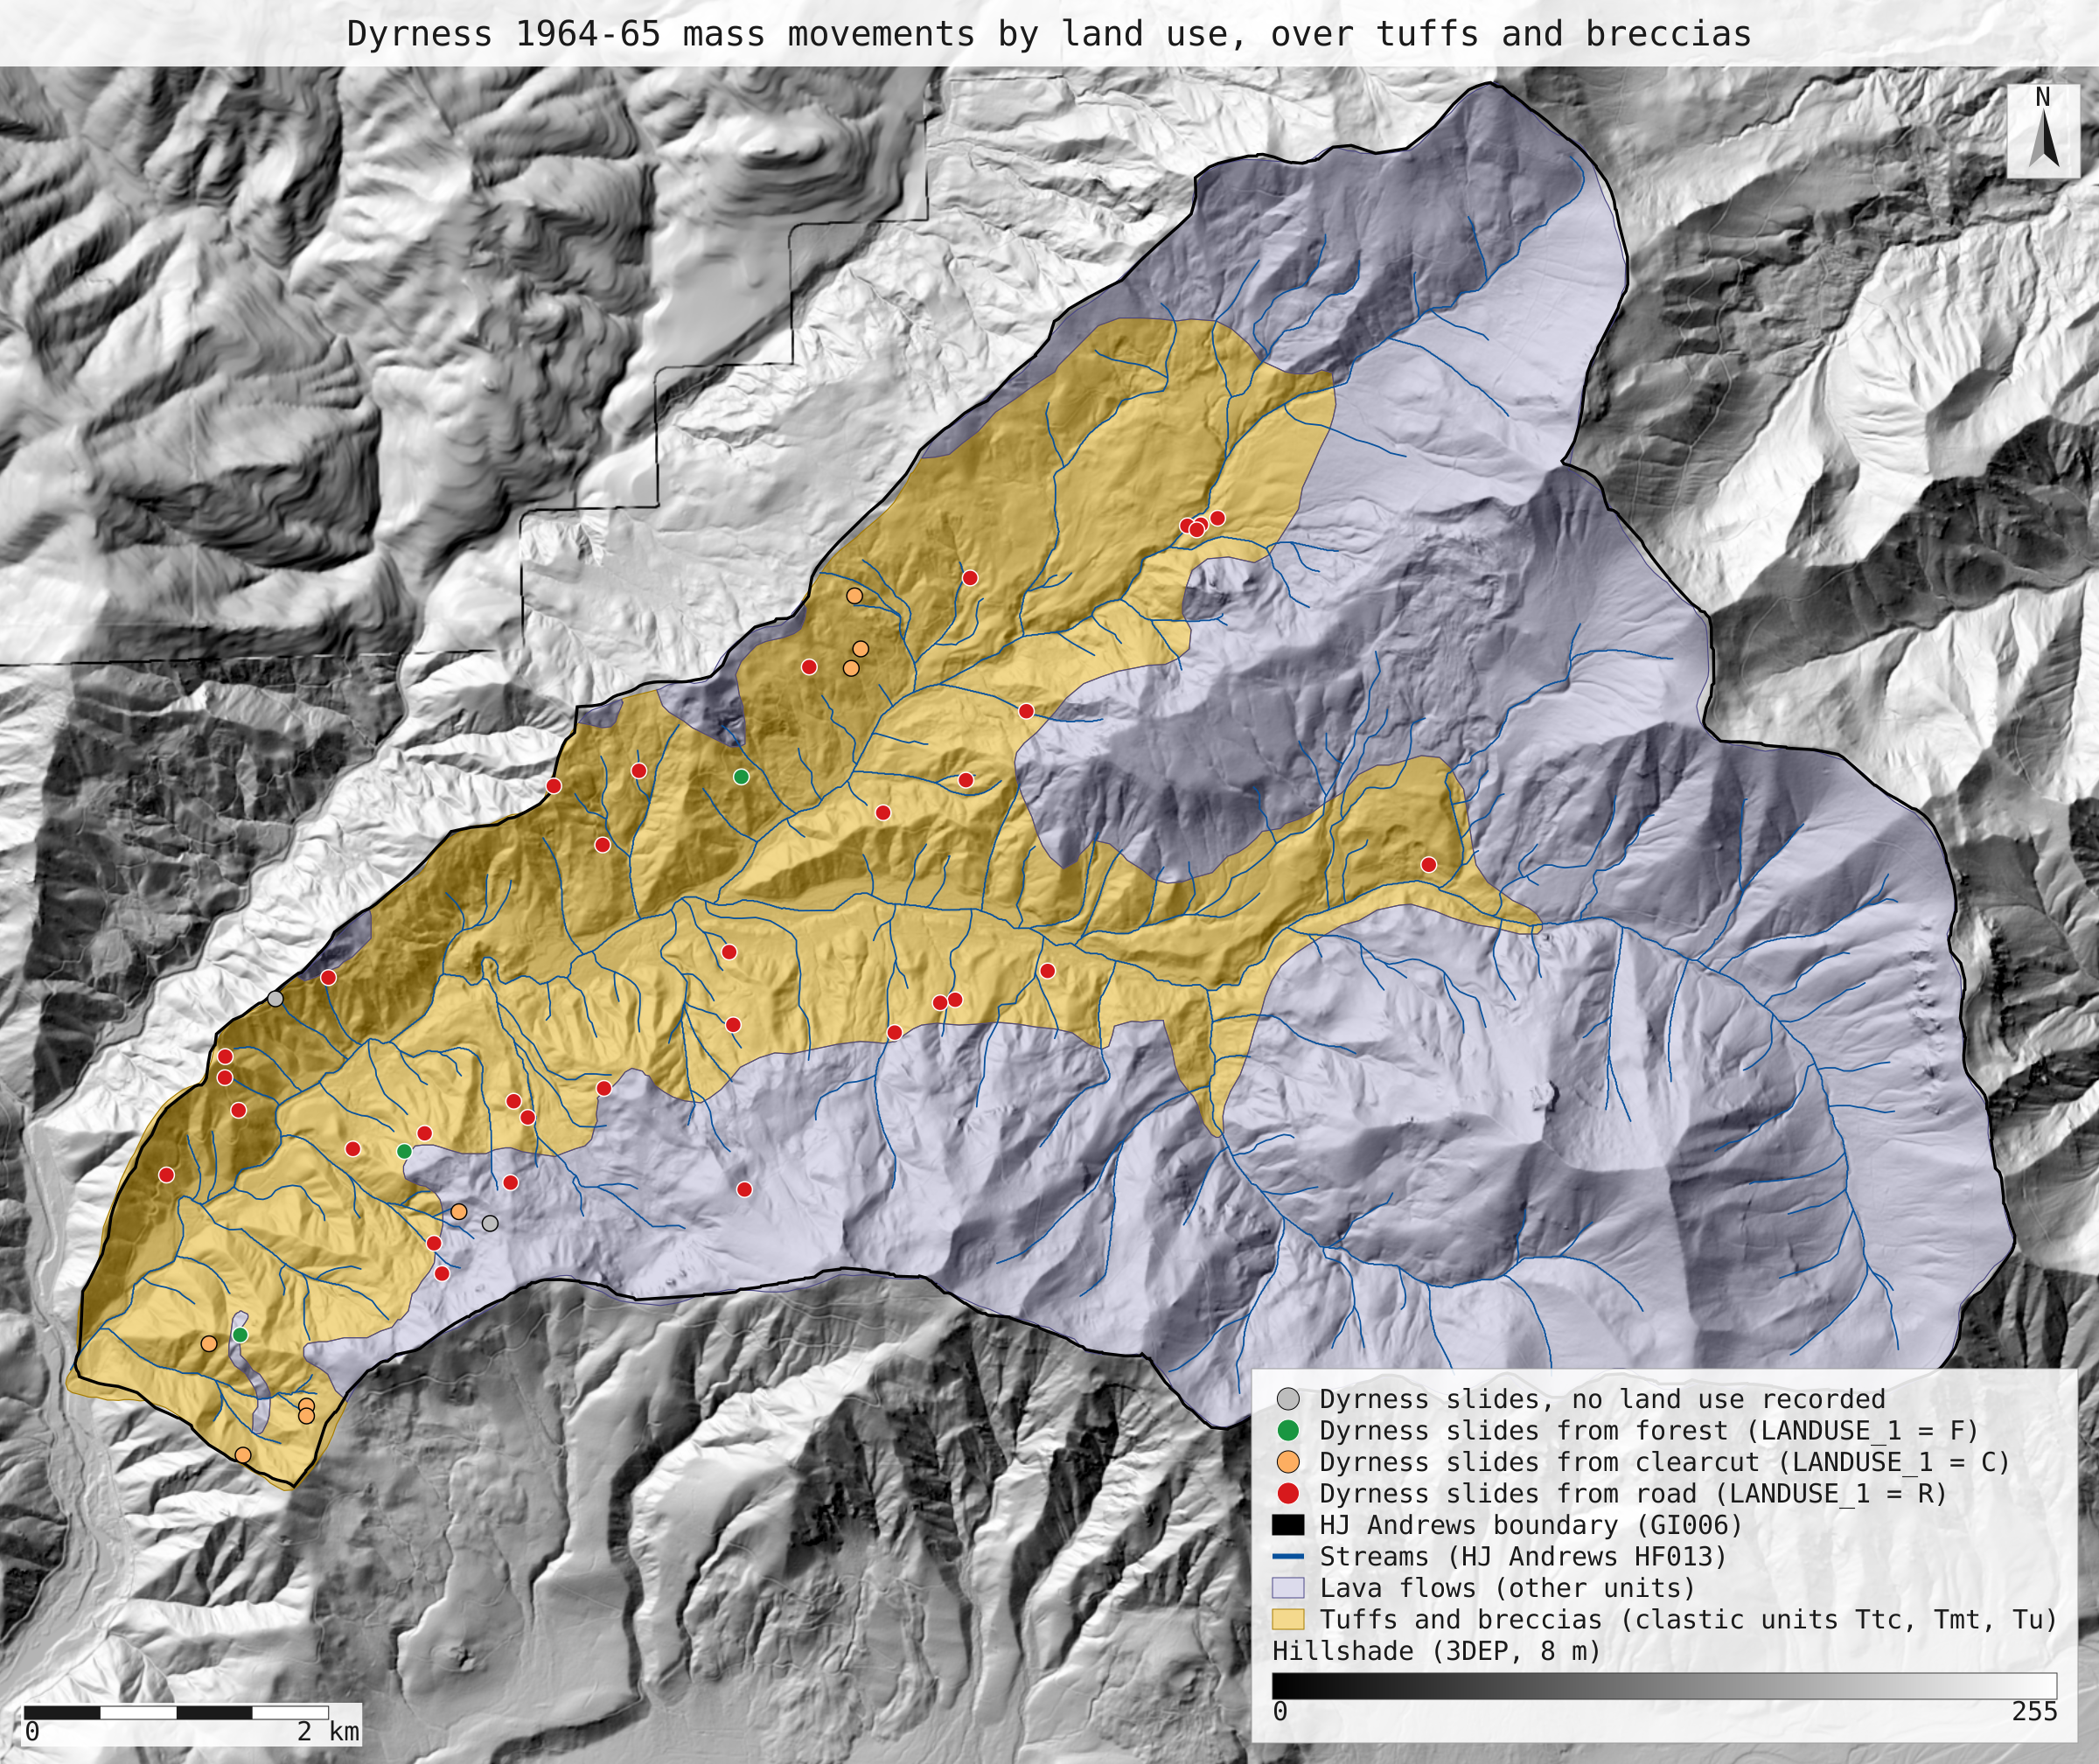
- dyrness_slides_geology.svg: the full-detail map
Limits
- The inventory points were screen-digitised from field maps (GE012 metadata), so each is a location to within tens of metres, not the outline of the movement. The join uses the point.
- The geology map is not the one Dyrness used: it was compiled in 1991 from Priest et al. (1988) and Swanson & James (1975). It covers 63.5 km², 0.2% less than the 63.7 km² boundary polygon.
- The paper's 1.8 percent of the forest in road rights-of-way in 1965 cannot be measured from open data: the open road layers carry no construction dates.
- Areas are in UTM zone 10N, not an equal-area projection; at the Andrews the UTM scale error is under 0.1%.