Five centuries of fire, then the Lookout Fire
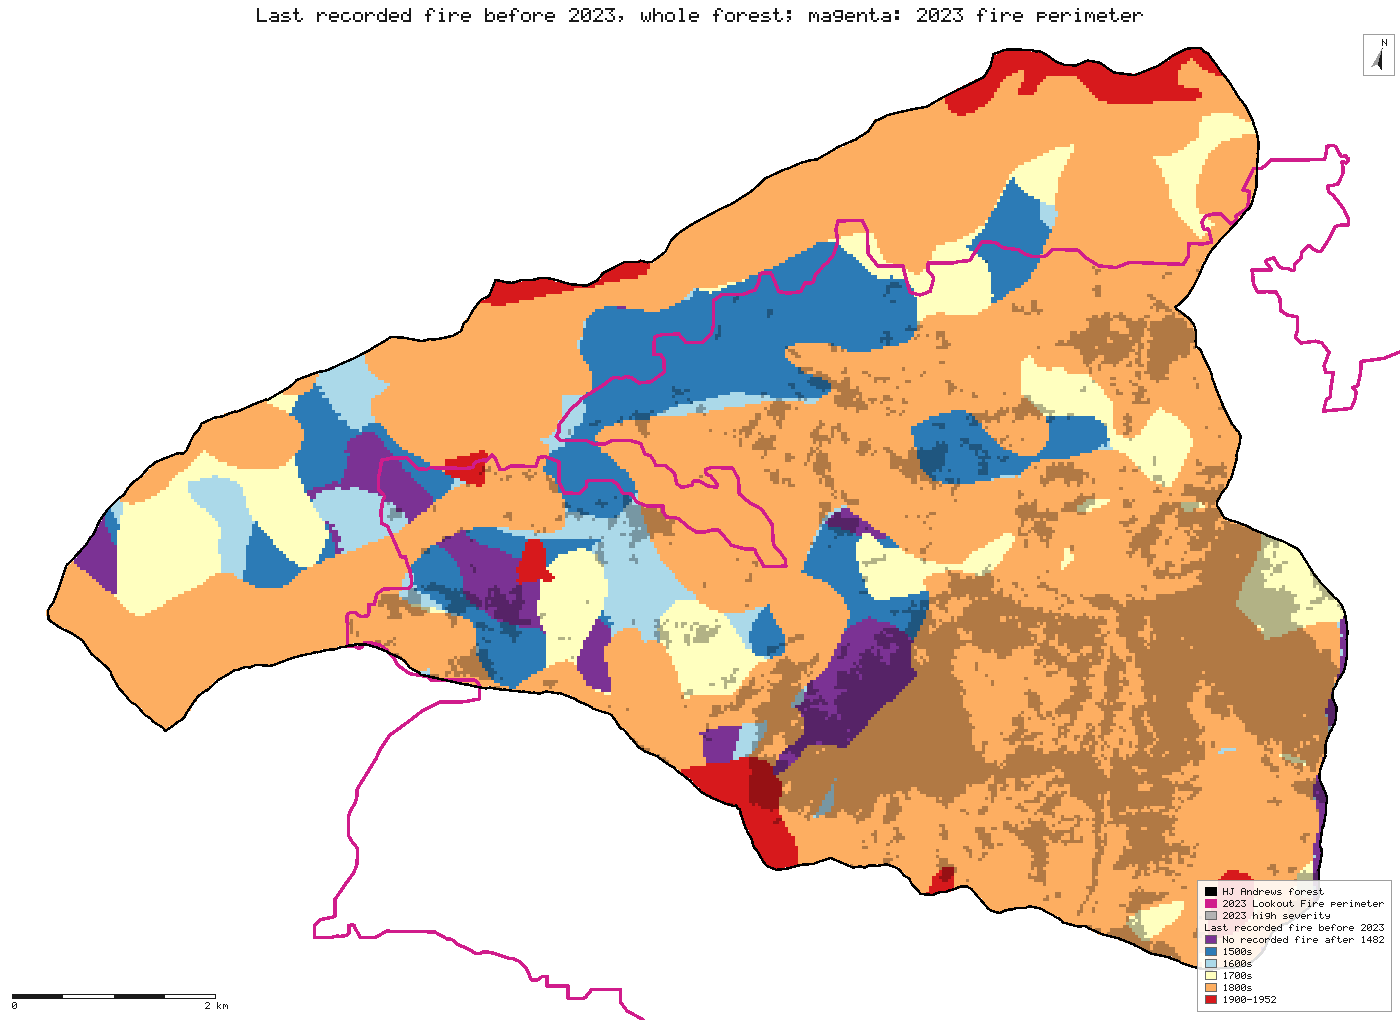
The HJ Andrews fire-history map records 31 fires between 1532 and 1952. Counting every 30 m cell once, ground whose last recorded fire was in the 1500s burned at high severity in the 2023 Lookout Fire at 8–9%, against 28.5% overall. That holds however the fire-history layer is aligned. An earlier claim that ground with no recorded fire after 1482 burned hottest did not hold, and is withdrawn.
- High severity on ground last burned in the 1500s9.0%new
- High severity over the whole area28.5%new
[228]
[11]
[445, 670, 895, 1123]
Numbers in brackets, like [14], are step numbers in this study's run.json: the NativeGIS call that returned the figure. NativeGIS 0.3.0, recorded 2026-10-31 04:52 UTC.
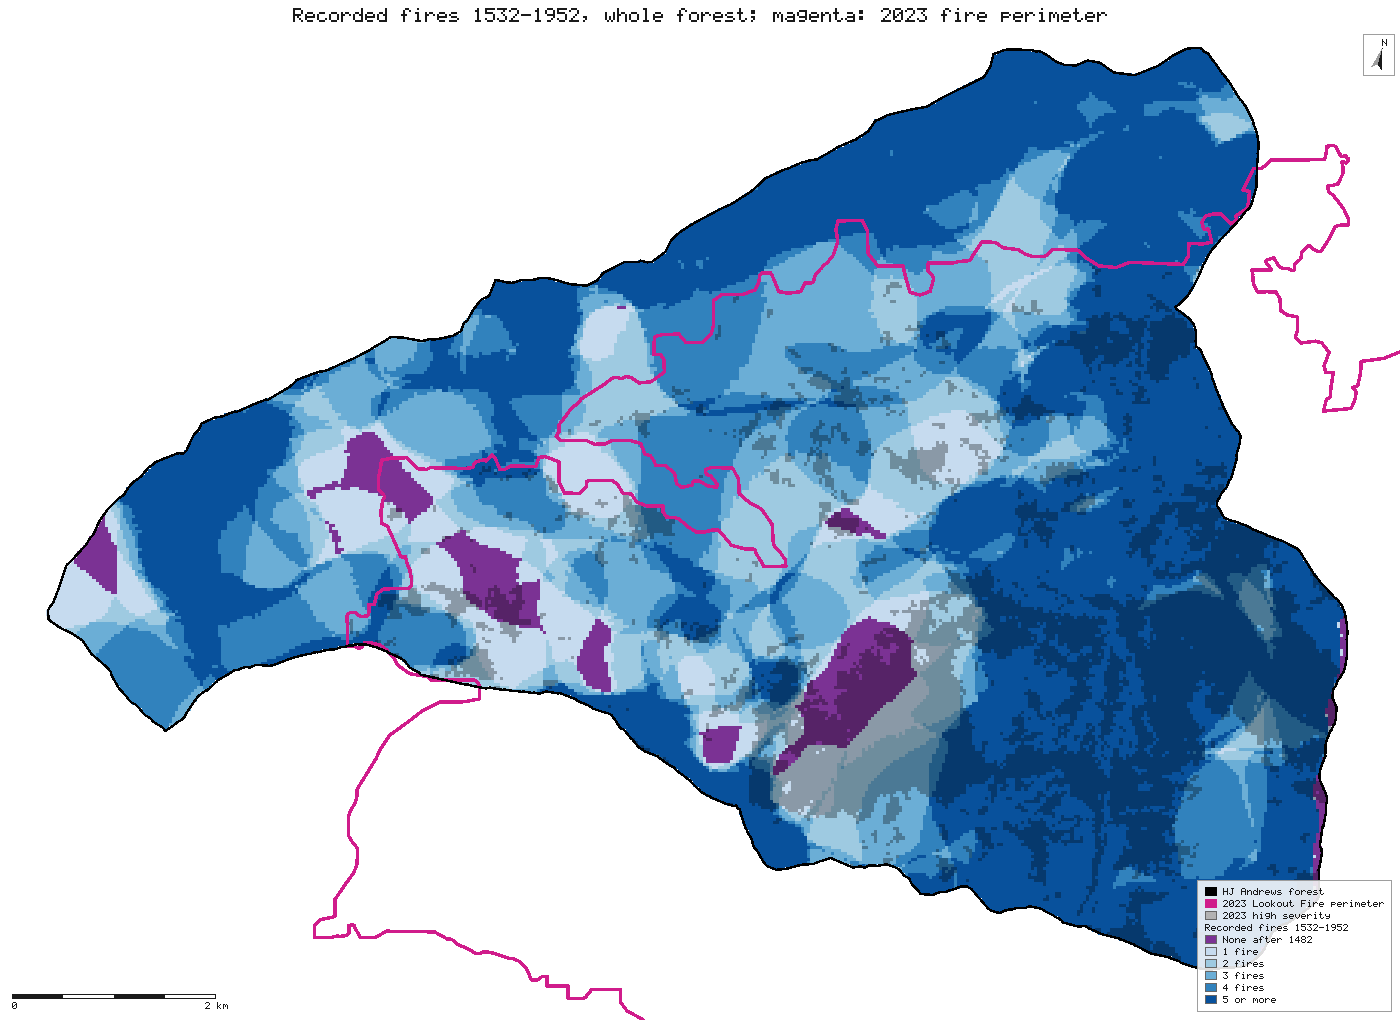
How many times each cell burned
The number of recorded fires per cell, 1532–1952, over the whole forest, with the 2023 perimeter outlined in magenta and 2023 high severity shaded grey. Most of the high-severity core in the south-east burned five or more times in the record. The numbers count only the cells inside the perimeter.
Click or tap a map to open it full screen, then zoom and pan.
What was published
A map of the individual fires from 1482 to 1952, reconstructed from tree rings and fire scars and digitised from 31 episode maps. The 258 polygons come from overlaying those maps. 197 are marked fire present (AGE = 0) with the episode's year, and 61 are marked fire absent (AGE = 1, no year). Polygons overlap wherever the same ground burned in several fires. The 1482 polygon is different from the rest: one polygon spanning the whole reconstruction area with a stair-stepped edge, so this page treats it as the record's base and not as a fire. The thesis's own stand statistics, and the later Tepley et al. 2013 analysis, rest on plot data behind the HJ Andrews registration form, so this page re-derives no published number.
The data and where it came from
All of it is open: downloaded without an account or a form.
| Data | Where | Licence |
|---|---|---|
| DF019 fire-history polygons, firehistory_region.shp: 258 polygons with EPISODE (year) and AGE (0 = fire present), NAD83 UTM zone 10N | HJ Andrews LTER, 1.6 MB zip, no form or account https://andrewsforest.oregonstate.edu/sites/default/files/lter/data/studies/spatialdata/df01901.zip | HJ Andrews data policy (CC BY, acknowledgement requested) |
| HJ Andrews boundary (GI006), and the MTBS Lookout Fire perimeter and severity, as in R9 | HJ Andrews LTER https://andrewsforest.oregonstate.edu/sites/default/files/lter/data/studies/spatialdata/gi00601.zip | CC BY (boundary); public domain (MTBS) |
The input files the run read, pinned by checksum
| File (relative to the data folder) | Bytes | sha256 |
|---|---|---|
samples/hja-open/gi00601/x/boundary83.shp | 10,540 | 0774de0a9ebd9693… |
samples/lookout/x/or4422212214620230806_20230731_20240826_burn_bndy.shp | 33,644 | 44058cc0c370ce97… |
samples/lookout/x/or4422212214620230806_20230731_20240826_dnbr6.tif | 398,684 | 221e116ff1ab8180… |
samples/lookout/x/or4422212214620230806_20230731_20240826_dnbr.tif | 774,936 | 9bc6bed26d918204… |
samples/hja-open/df01901/x/firehistory_region.shp | 2,204,480 | f1bd94a45b911c1e… |
Full checksums are in run.json. Replay refuses an input whose checksum differs.
Method
- Prepare the 2023 side as in R9: the forest boundary in equal-area Albers, its intersection with the fire perimeter, and the MTBS severity classes clipped to it. A 0/1 raster marks high severity (class 4).
- Open the fire-history polygons and keep those marked fire present, leaving out the 1482 base polygon. Reproject them to EPSG:5070 and dissolve them by year, which gives one feature for each of the 31 fires.
- For each fire, mark the 30 m cells of the 2023 fire area whose centre falls inside it. Then for every cell take the year of its last recorded fire and the number of recorded fires. Ground covered by several fires is counted once, under its latest fire.
- Cross-tabulate both per-cell layers with 2023 high severity. Each cell gets the code class × 10 + high, and a reclassify counts the cells per code.
- Maps: the last recorded fire and the number of fires for every cell of the forest (the fire history covers all of it), with the 2023 perimeter outlined and 2023 high severity shaded inside it. Only the cells inside the perimeter go into the tables.
The run made 1124 NativeGIS calls: gis_open × 5, gis_process × 413, gis_query × 158, gis_close × 546, gis_render × 2.
The numbers
By the last recorded fire before 2023
| Last recorded fire | Cells (n) | Share of the area | Burned at high severity in 2023 |
|---|---|---|---|
| No recorded fire after 1482 | 2,364 | 5.0% | 41.1% (972) |
| 1500s | 5,742 | 12.0% | 9.0% (516) |
| 1600s | 1,543 | 3.2% | 16.5% (254) |
| 1700s | 4,117 | 8.6% | 16.0% (658) |
| 1800s | 32,830 | 68.8% | 33.5% (11,009) |
| 1900–1952 | 1,129 | 2.4% | 15.6% (176) |
| Whole area | 47,725 | 100.0% | 28.5% |
Each 30 m cell is counted once [228].
By the number of recorded fires, 1532–1952
| Recorded fires | Cells (n) | Share of the area | Burned at high severity in 2023 |
|---|---|---|---|
| None after 1482 | 2,364 | 5.0% | 41.1% (972) |
| 1 | 3,909 | 8.2% | 29.7% (1,160) |
| 2 | 6,020 | 12.6% | 23.5% (1,415) |
| 3 | 7,080 | 14.8% | 15.5% (1,098) |
| 4 | 7,570 | 15.9% | 16.3% (1,236) |
| 5 or more | 20,782 | 43.5% | 37.1% (7,704) |
| Whole area | 47,725 | 100.0% | 28.5% |
Each 30 m cell is counted once [230].
Method: the 31 fire episodes after 1482 (DF019 polygons marked fire present), reprojected to EPSG:5070 and dissolved by year [15, 17]. For each episode, the zone's cells whose centre falls inside it [21]; then per cell the latest year and the count [224, 226]; each crossed with a 0/1 raster of MTBS high severity [11]. Units: 30 m cells (900 m²). n = 47,725 cells, the HJ Andrews part of the 2023 fire perimeter.
Does the 200 m misregistration change the answer?
The fire-history layer sits about 200 m south of the forest boundary and of the 2018 LiDAR-based watershed. Here the per-cell tables are rebuilt with the layer moved north by each measured offset (gis_process translate, in its own UTM projection, before everything else), and, in the last column, re-registered to Teensma's own 1987 maps (see Compared with the published maps below). Each cell: share burned at high severity in 2023 (cells).
The re-registration is the best-supported alignment: it corrects the north–south stretch rather than moving the whole layer. DF019 is moved to a local origin, then put through georeference [908], which on a vector treats input coordinates as column and row, so it applies a plain affine. Its 342 control points are measured transect pairs (every second one), each a DF019 edge and the same edge on one of Teensma's registered maps. The affine scales north–south by 0.9774 and leaves east–west unchanged. Its RMSE is 43 m and its leave-one-out error 44 m, about the registration error of Teensma's maps themselves, so a single affine describes the distortion as well as the maps can show it. The op reports the fit in pixel terms; here a pixel is a metre.
Last recorded fire, shifted
| As published | moved 200 m north [445] | moved 15 m east, 143 m north (mean offset from the forest boundary) [670] | moved 4 m east, 161 m north (mean offset from the LiDAR watershed) [895] | Re-registered to Teensma 1987 (best supported) [1123] | |
|---|---|---|---|---|---|
| No recorded fire after 1482 | 41.1% (2,364) | 29.4% (2,243) | 32.2% (2,225) | 30.9% (2,241) | 31.8% (2,234) |
| 1500s | 9.0% (5,742) | 8.1% (4,995) | 8.7% (5,228) | 8.4% (5,121) | 8.9% (5,305) |
| 1600s | 16.5% (1,543) | 18.5% (1,526) | 18.2% (1,561) | 18.8% (1,567) | 17.3% (1,545) |
| 1700s | 16.0% (4,117) | 12.9% (3,702) | 13.2% (3,814) | 13.2% (3,763) | 13.3% (3,876) |
| 1800s | 33.5% (32,830) | 34.0% (33,784) | 33.9% (33,525) | 33.9% (33,636) | 34.0% (33,346) |
| 1900–1952 | 15.6% (1,129) | 18.8% (1,475) | 18.8% (1,372) | 18.8% (1,397) | 18.9% (1,419) |
Number of recorded fires, shifted
| As published | moved 200 m north [447] | moved 15 m east, 143 m north (mean offset from the forest boundary) [672] | moved 4 m east, 161 m north (mean offset from the LiDAR watershed) [897] | Re-registered to Teensma 1987 (best supported) [1125] | |
|---|---|---|---|---|---|
| None after 1482 | 41.1% (2,364) | 29.4% (2,243) | 32.2% (2,225) | 30.9% (2,241) | 31.8% (2,234) |
| 1 | 29.7% (3,909) | 28.3% (3,827) | 29.6% (3,839) | 29.1% (3,828) | 29.7% (3,754) |
| 2 | 23.5% (6,020) | 27.4% (5,838) | 26.5% (5,921) | 26.9% (5,891) | 25.9% (5,917) |
| 3 | 15.5% (7,080) | 19.2% (6,918) | 18.0% (6,979) | 18.3% (6,946) | 18.6% (6,954) |
| 4 | 16.3% (7,570) | 17.6% (7,489) | 16.9% (7,566) | 17.3% (7,552) | 16.8% (7,521) |
| 5 or more | 37.1% (20,782) | 35.5% (21,410) | 36.0% (21,195) | 35.8% (21,267) | 35.9% (21,345) |
Compared with the published maps: where the 200 m offset came from
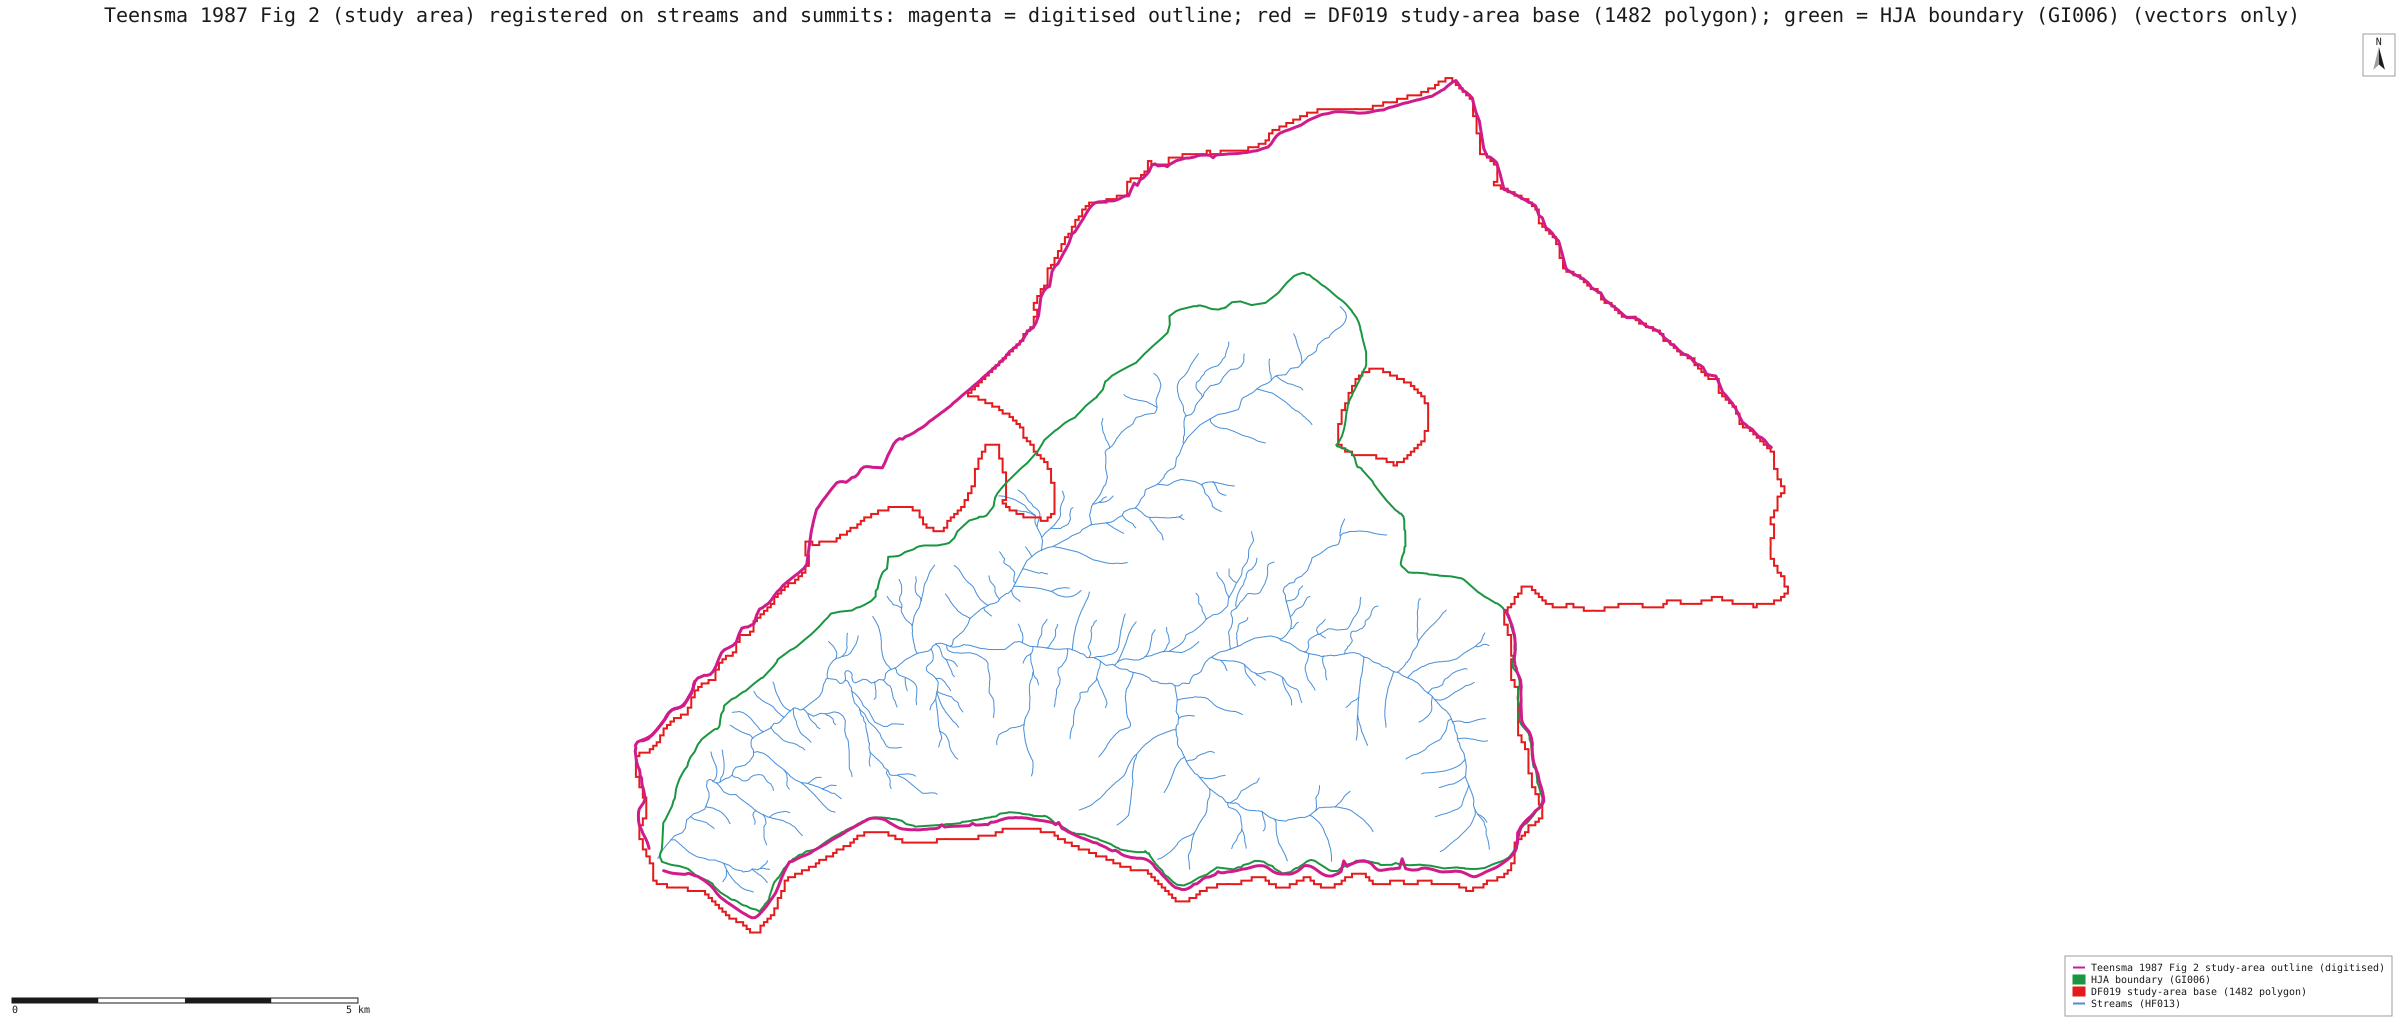
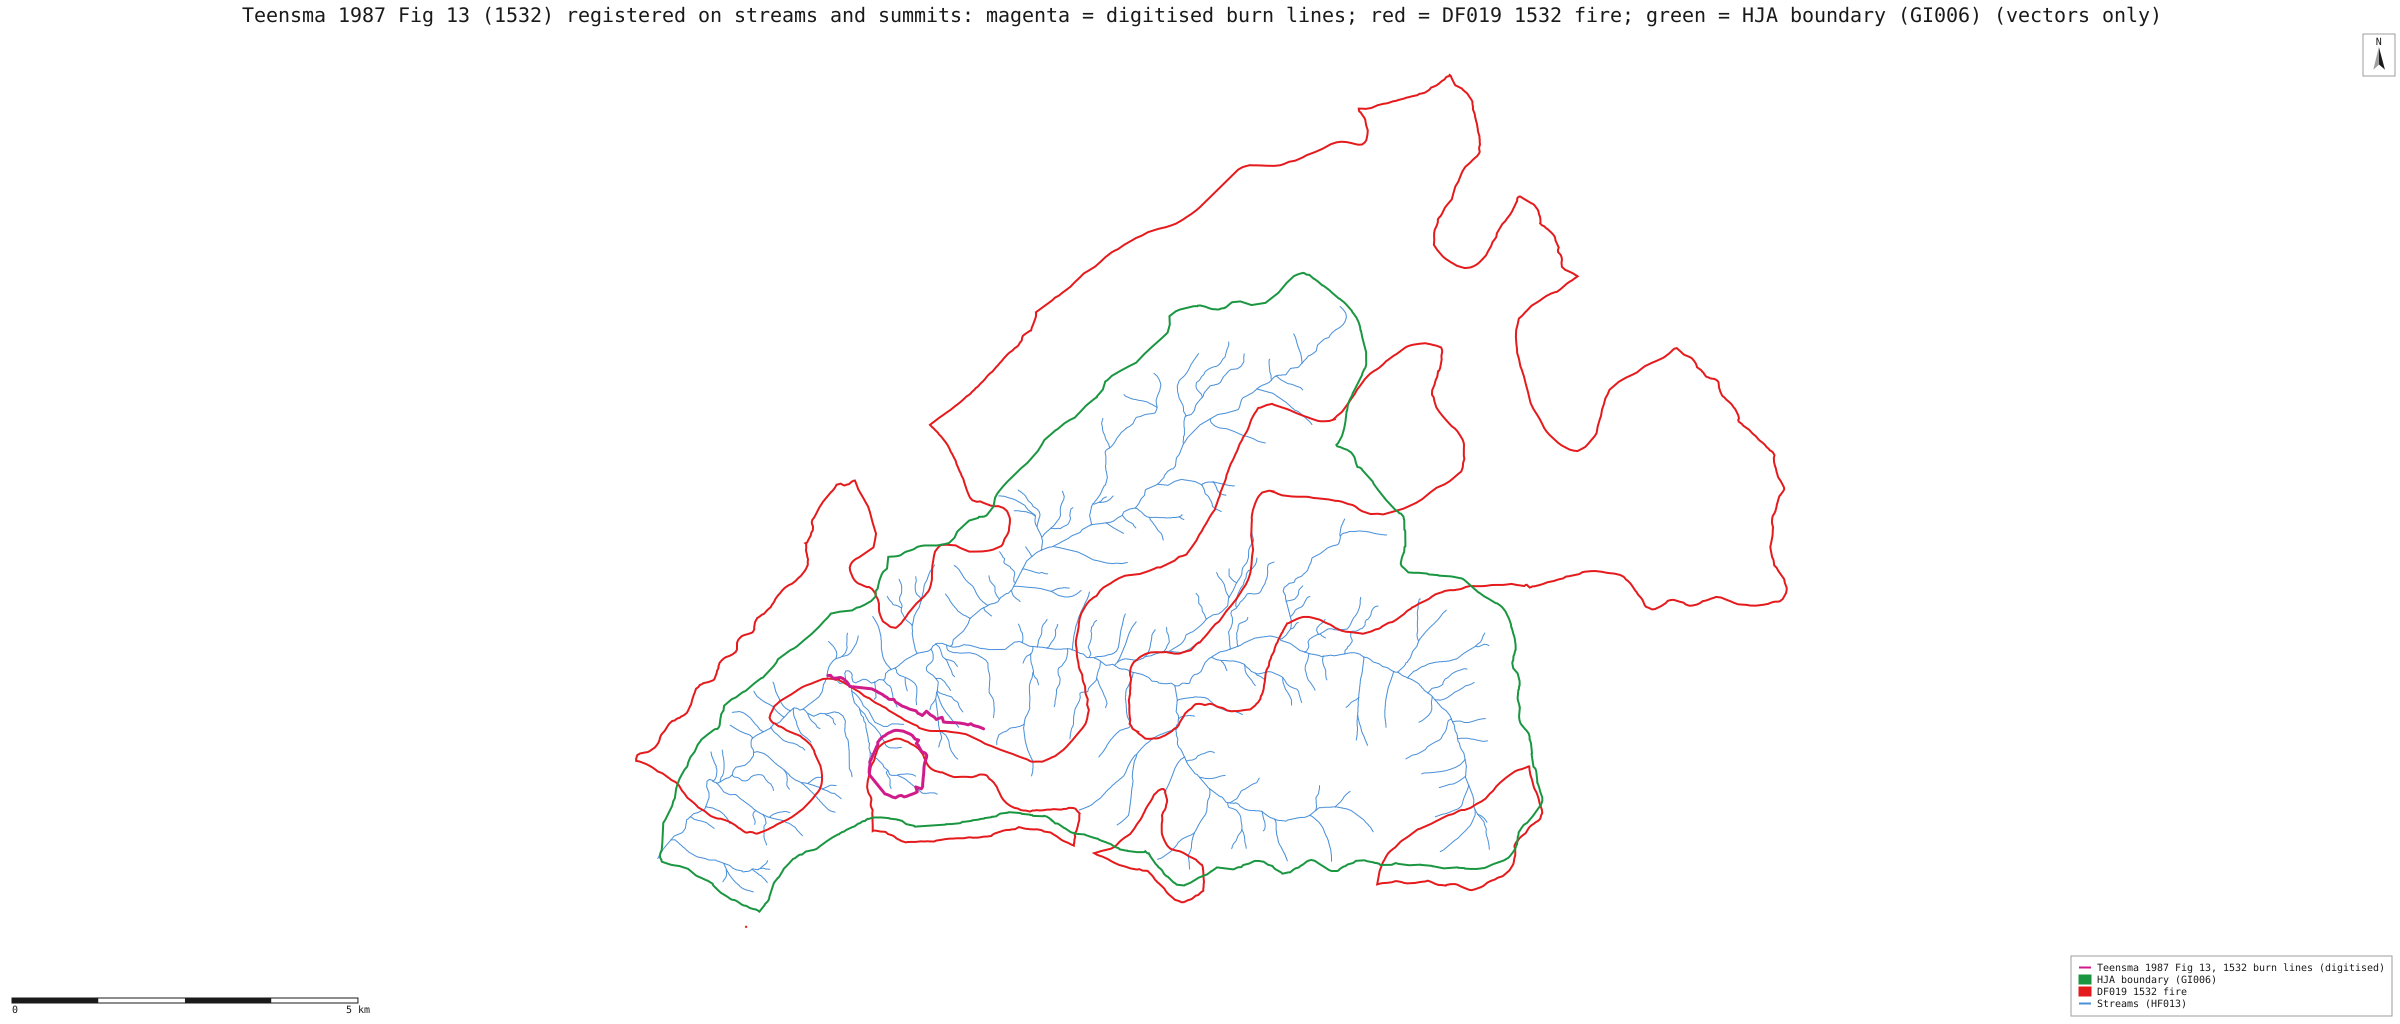
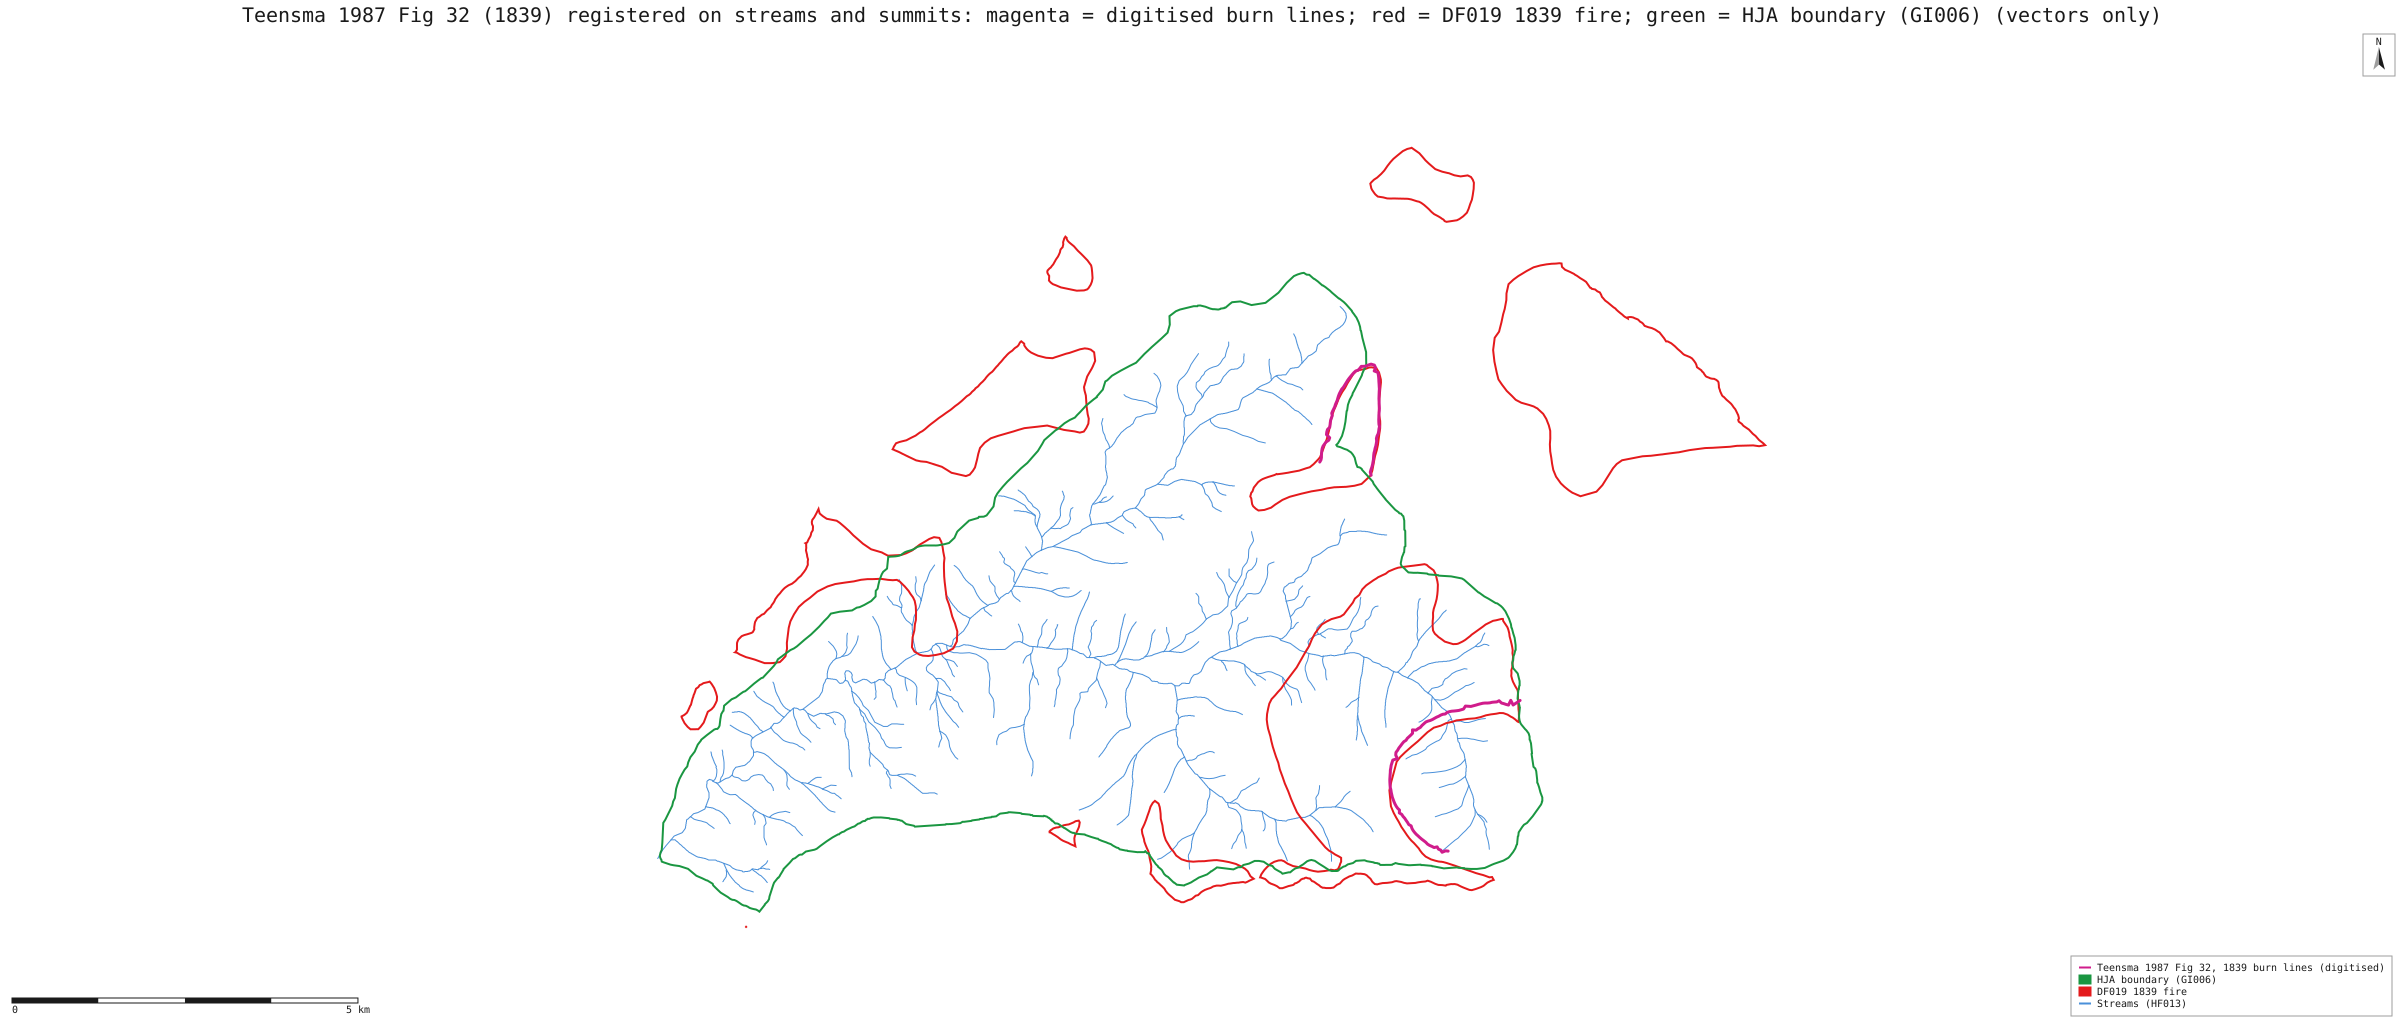
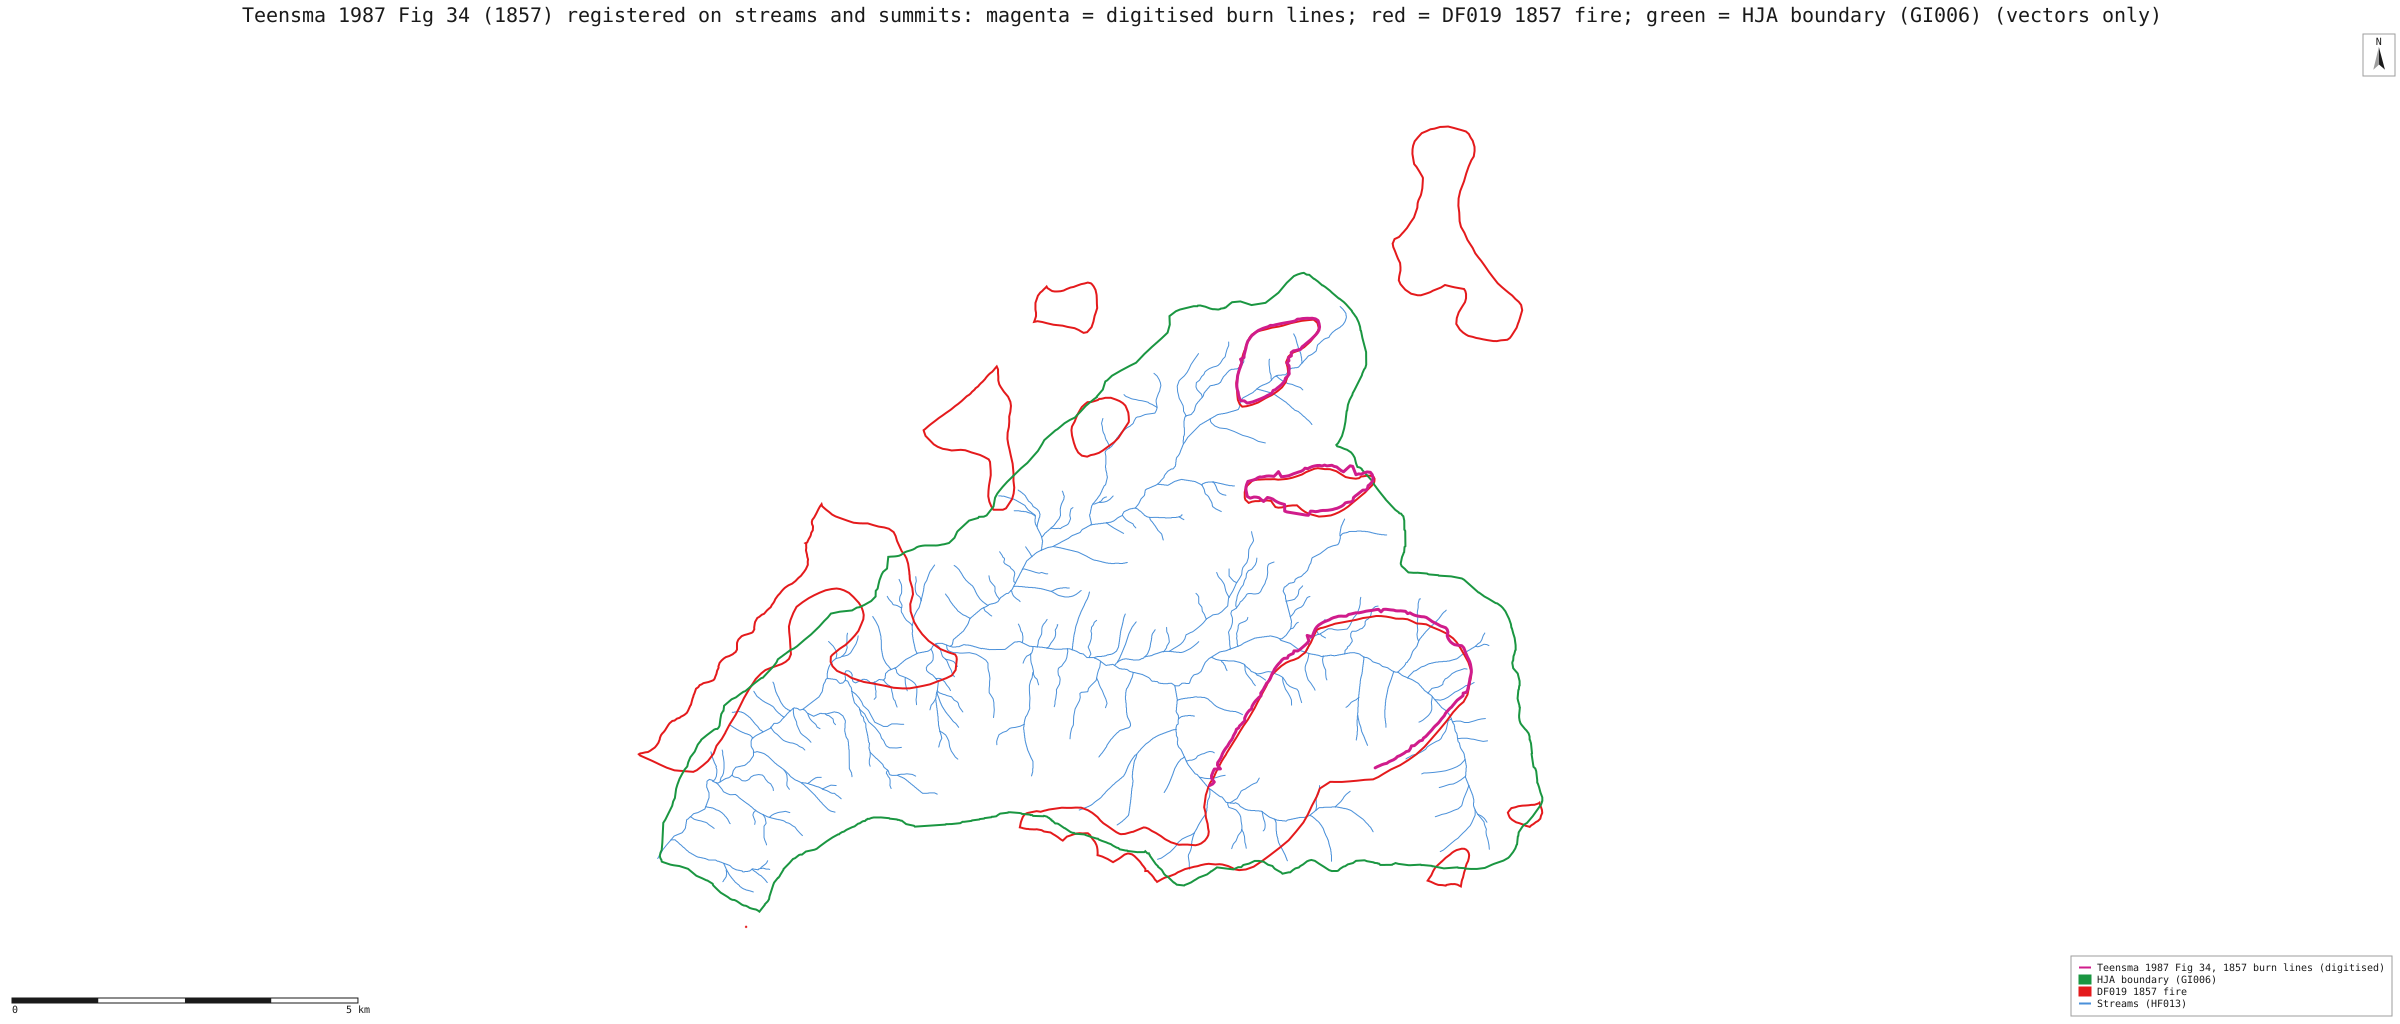
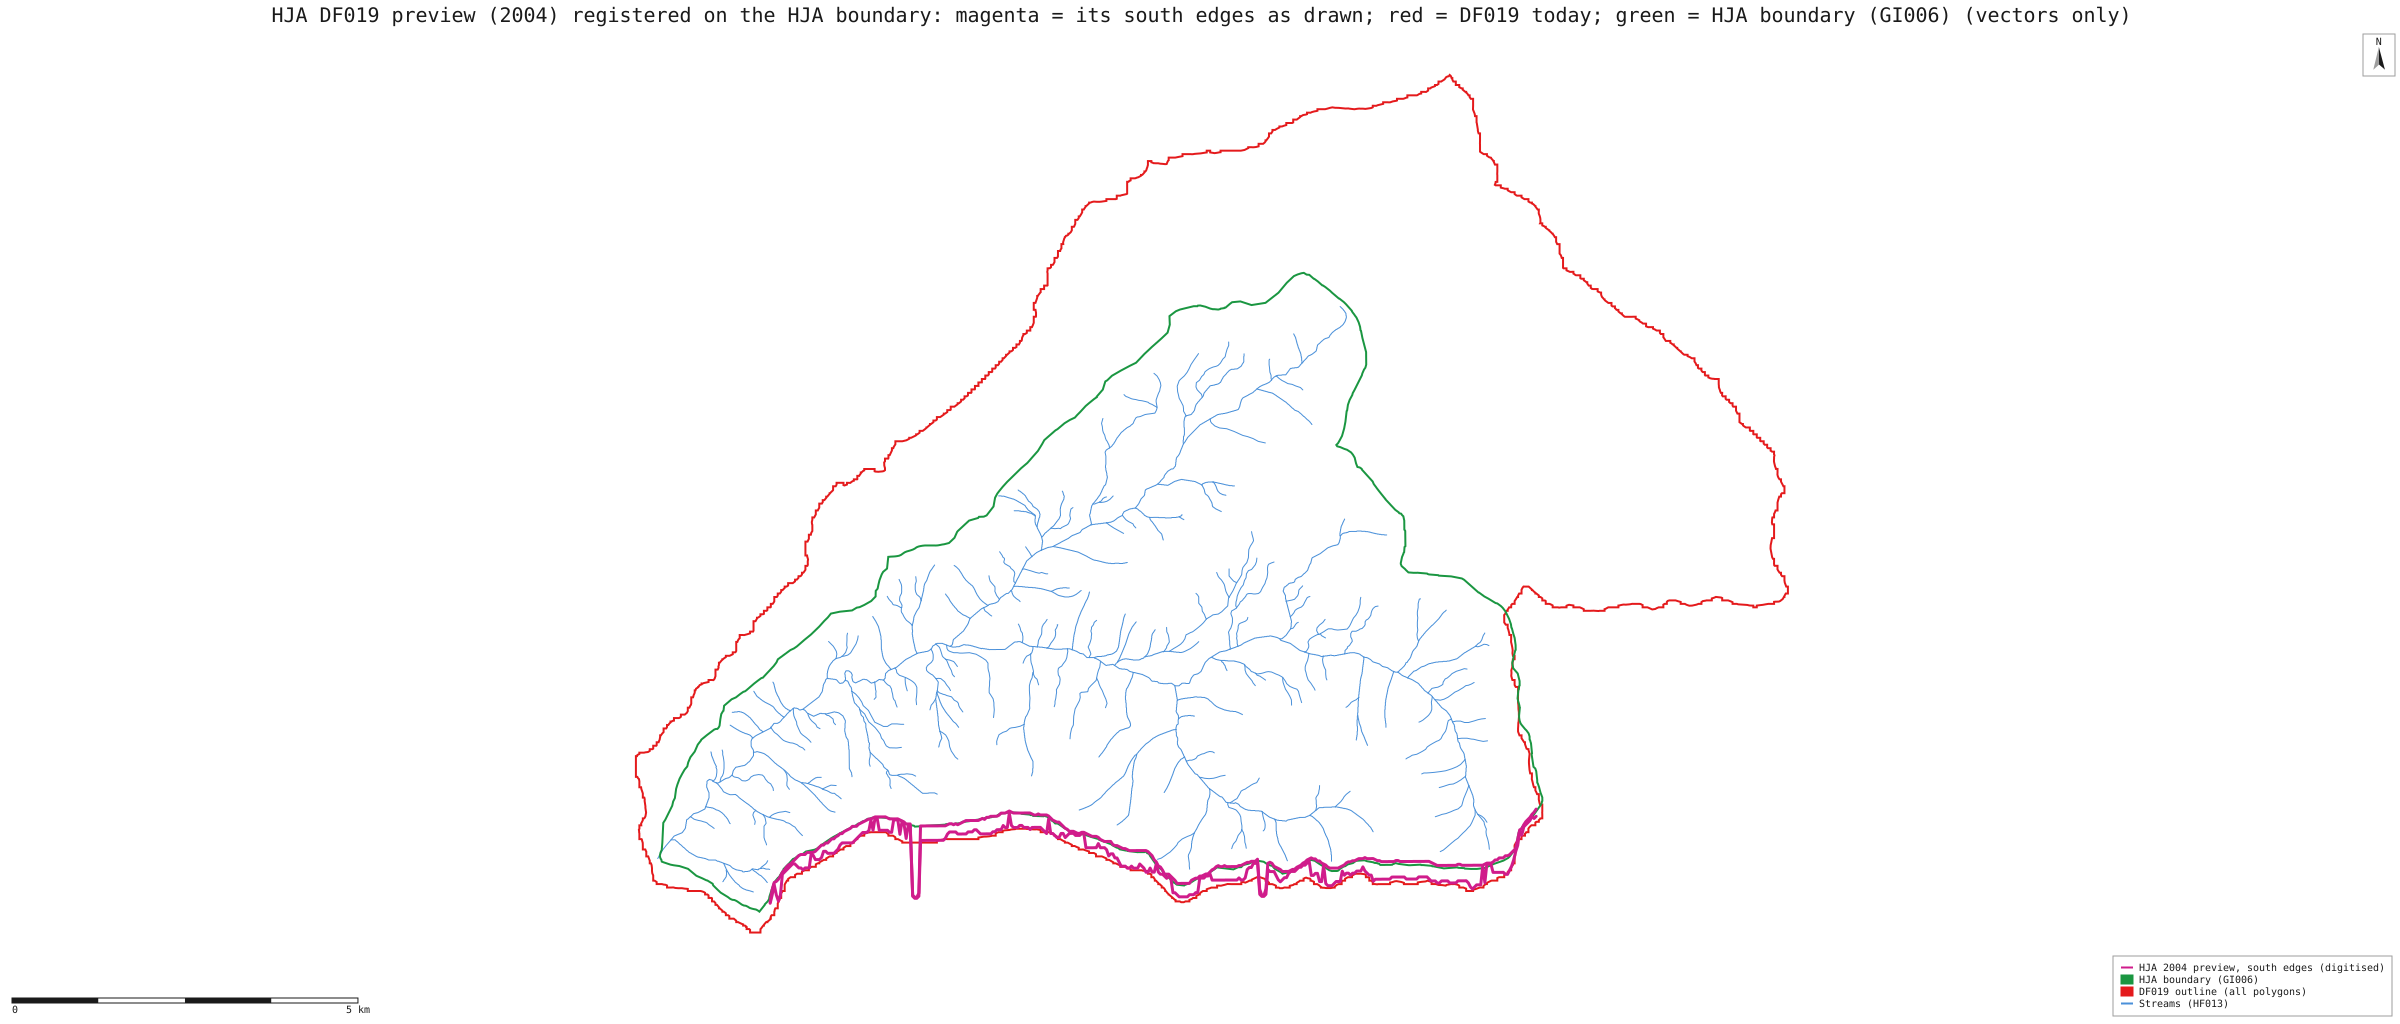
To find where DF019's southward offset entered, Teensma's own 1987 maps and the 2004 HJ Andrews preview of DF019 were placed on the ground with NativeGIS's georeference and measured against DF019 along north–south transects. Teensma's maps were registered only on features that are not fire lines: 2 stream confluences and 4 closed-contour summits. The preview was registered on the HJ Andrews boundary.
- The offset is in DF019, not in Teensma's maps. Teensma's study-area outline sits 58 m south of the HJ Andrews boundary on Lookout Ridge, about one registration error (leave-one-out 43 m). DF019 sits 183 m south of Teensma's line there [34, 24].
- It is a stretch, not a shift. At the north edge DF019 and Teensma agree (−13 m). The gap grows by about 21 m for each kilometre south (r = −0.92 over 9 segment means), from zero near northing 4,903.0 km: about a 2% north–south stretch. East–west offsets are within about one registration error. A datum mislabel would be a uniform shift with an east–west part, so it is unlikely.
- It was there in 2004. On the 2004 preview, registered on the boundary (its own boundary lands within 20 m of GI006), DF019 already runs 157 m south of the boundary [133, 143]. That is before the 2009 NAD27-to-NAD83 conversion, so the conversion did not cause it.
- Most likely source: the processing step the DF019 metadata dates August 1997, in which the fire episodes from Teensma's roughly 1:90,909 maps were "manuscripted onto HJA base maps and digitized". These measurements cannot tell the manuscripting from the digitiser registration.
| Lines compared (north–south) | Mean | Median | n | Registration error (leave-one-out) | Reading |
|---|---|---|---|---|---|
| Teensma Fig. 2 outline vs HJ Andrews boundary (GI006), south edge | −58 m | −58 m | 212 | 43 m | negative: Teensma's line is south of GI006, by about one registration error [34] |
| Teensma Fig. 2 outline vs DF019 base polygon, south edge | +183 m | +183 m | 223 | 43 m | positive: DF019 is south of Teensma [24] |
| Teensma Fig. 2 outline vs DF019 base polygon, north edge | −13 m | −13 m | 197 | 43 m | they agree [24] |
| Teensma Fig. 13, fire of 1532: burn lines vs DF019's same fire | +126 m | +138 m | 52 | 45 m | positive: DF019 south of Teensma; larger where the lines lie further south [60] |
| Teensma Fig. 32, fire of 1839: burn lines vs DF019's same fire | +159 m | +171 m | 42 | 55 m | positive: DF019 south of Teensma; larger where the lines lie further south [85] |
| Teensma Fig. 34, fire of 1857: burn lines vs DF019's same fire | +54 m | +59 m | 158 | 38 m | positive: DF019 south of Teensma; larger where the lines lie further south [110] |
| 2004 preview: DF019 south edges vs GI006 | −157 m | −178 m | 131 | 70 m | DF019 already south of the boundary in 2004 [143] |
| 2004 preview: DF019 then vs DF019 now | +83 m | +70 m | 140 | 70 m | about one registration error: not resolved [153] |
Method. Teensma 1987 Fig 2 (study area): affine fit on 6 points, RMSE 21 m, leave-one-out 43 m [15]; Teensma 1987 Fig 13 (1532): affine fit on 6 points, RMSE 22 m, leave-one-out 45 m [51]; Teensma 1987 Fig 32 (1839): affine fit on 6 points, RMSE 28 m, leave-one-out 55 m [76]; Teensma 1987 Fig 34 (1857): affine fit on 6 points, RMSE 19 m, leave-one-out 38 m [101]; HJA DF019 preview (2004): similarity fit on 8 points, RMSE 54 m, leave-one-out 70 m [127]. Teensma's scans have about 3% more scale across than down, so an affine fit is used for them. Transects every 50 m pair each digitised line with the nearest DF019 or GI006 edge within 450 m. The pairs are measured with gis_compare (points by key), whose means are printed above. The medians, per-segment means and the trend are plain arithmetic on the same pairs (summary.json). Two contour rings were rejected as controls because their leave-one-out errors were 160 and 207 m. NativeGIS has no line-with-line intersection yet, so the transect crossings were found in the driving script. The run, published-maps-run.json (163 steps), replays identically in a fresh session. It reads the scanned figures, which are not redistributed here.
The figures. P. D. A. Teensma (1987), Fire history and fire regimes of the central western Cascades of Oregon, PhD dissertation, University of Oregon: Figs. 2, 13, 32 and 34 (PDF from HJ Andrews, pub716). The HJ Andrews DF019 catalogue preview, dated 13 December 2004 (image). They were used as analysis inputs only. The maps below draw only our digitised lines and the open layers, not the figures.

What this means for the sensitivity table. Moving all of DF019 north by 200 m fixes the south edge but moves the northern half 150–200 m too far. A north–south scale of about 0.979 about northing 4,903 km would match the published maps. The sensitivity table above now includes that re-registration, fitted to the measured pairs themselves, as its last column.
What the numbers say, and what they do not
- There is no published number to differ from. This is a new cross-tabulation of two published datasets, labelled as such.
- Ground last burned in the 1500s burned least. 5,742 cells (12% of the area) last burned in the 1500s, and 9.0% of them burned at high severity in 2023, against 28.5% overall. These are old forest patches that the later fires missed, mostly in the north and west of the fire area.
- But older is not simply cooler, and the other differences depend on alignment. As published, ground with no recorded fire after 1482 (5% of the area) burned high 41% of the time. With the layer moved to line up with the forest boundary, that drops to 29–32%, about average. Ground last burned in the 1800s (69% of the area) burned high 33.5% of the time, and about 34% when aligned. The number of fires shows no steady pattern either way: about 16–19% high where three or four fires were recorded, and 35–37% where five or more were.
- The misregistration was tested, not assumed away. The fire-history layer sits about 200 m south of where the forest boundary and the modern LiDAR watershed put the same ridgelines. The tables were rebuilt with the layer moved north by each measured offset (200 m, 143 m and 161 m) and once re-registered to Teensma's own maps, which corrects the north–south stretch. Only the 1500s finding survives every version, so it is the only one this page states as a result. The claim that ground with no recorded fire after 1482 burned hottest (41%) is withdrawn: aligned, it is 29–32%, about average.
- An earlier version of this page counted fires, not ground. It gave each fire episode the share of its ground that burned high, then added episodes up by century. Ground that burned in several fires was counted once per fire: the 1800s row covered more cells than the whole area. That version also counted the 1482 polygon as a fire. This version counts each cell once, and the 1500s finding holds (9% against 28.5%).
- Correlation, not cause. Where the old fires burned follows the same terrain that steered the 2023 fire: aspect, slope position, the east–west run of the valley, and the 2023 weather. Testing whether fire history itself matters needs a model with terrain and weather, and the stand-level plot data.
Replay it yourself
The run file records every call, its arguments, the checksums of the files it read and the numbers it returned. Replaying it repeats every call in a fresh NativeGIS session and checks that each answer comes out the same.
- Make an empty data folder and fetch the inputs into it exactly as below (bash; the folder layout is the one the run file expects):
cd /path/to/an/empty/folder
mkdir -p samples/hja-open/gi00601 && curl -fL -o samples/hja-open/gi00601/gi00601.zip https://andrewsforest.oregonstate.edu/sites/default/files/lter/data/studies/spatialdata/gi00601.zip && unzip -o samples/hja-open/gi00601/gi00601.zip -d samples/hja-open/gi00601/x
mkdir -p samples/hja-open/df01901 && curl -fL -o samples/hja-open/df01901/df01901.zip https://andrewsforest.oregonstate.edu/sites/default/files/lter/data/studies/spatialdata/df01901.zip && unzip -o samples/hja-open/df01901/df01901.zip -d samples/hja-open/df01901/x
mkdir -p samples/lookout && curl -fL -o samples/lookout/LF_or4422212214620230806.zip https://andrewsforest.oregonstate.edu/sites/default/files/lter/fsdbdata/gis/LF_or4422212214620230806.zip && unzip -o samples/lookout/LF_or4422212214620230806.zip -d samples/lookout/x
- Download run.json (1,351,952 bytes, sha256
01b4986ac4bfe8de6576f015a5126b4c9691ec7441d11134d778fc1cae7411b4). - Ask your assistant to replay it with NativeGIS, or call the tool directly:
gis_replay {"action": "replay",
            "file": "<absolute path to the run.json you downloaded>",
            "inputRoot": "<your data folder>",
            "outputRoot": "<a new, empty folder>"}
Paths in the run file are relative to the data folder (inputRoot), and outputs go under outputRoot, so nothing depends on where the original run lived.
Files
- run.json: the recorded run: every call, its arguments and the numbers it returned
- published-maps-run.json: the recorded run that registers Teensma's figures and the 2004 preview and measures them against DF019 (it reads the scanned figures, which are not redistributed)
- published-maps-summary.json: control points, fits, leave-one-out errors and every offset, including the medians and per-segment means
Limits
- Known limitation: the fire-history layer (DF019) sits up to about 200 m south of the HJ Andrews boundary. Registering Teensma's own maps shows the offset is in DF019, not in his mapping: DF019 is stretched about 2% north to south against them, and the stretch was already there in the 2004 preview (see "Compared with the published maps"). The result was tested with the layer moved north by each of three measured offsets and re-registered to Teensma's maps (sensitivity table). The 1500s finding holds in all of them; the "no recorded fire after 1482 burned hottest" claim did not, and is withdrawn.
- Teensma's polygons are reconstructed from sampled trees, with smooth boundaries drawn between sample sites. Their long sweeping edges are in the published file as drawn (we checked one episode before and after every processing step). They are much less certain than a 30 m satellite cell. The metadata calls the boundaries uncertain.
- The reconstruction covers all of the HJ Andrews forest except about 14 ha, and the maps show all of it. The tables count only the cells inside the 2023 fire perimeter, where there is a 2023 severity to compare.
- The file says it was converted from NAD27 to NAD83 with the NADCON transform. The 2004 preview, made before that conversion, already shows the offset, and the offset grows southward rather than being a uniform shift. So the conversion is not the cause; the 1997 digitising of Teensma's maps most likely is. Moving the whole layer over-moves its northern half, so the sensitivity table also re-registers DF019 to Teensma's maps with an affine fitted to the measured pairs (north–south scale 0.977): the best-supported alignment.
- Fires before 1532 are not in the record except as the 1482 base, so "no recorded fire after 1482" means no fire in this record, not no fire at all.