Debris slides after the February 1996 flood
The February 1996 flood started 36 debris slides larger than 75 m³ in the Andrews, against 72 after the 1964 flood. The open inventory gives exactly 36 for 1996, with the same split between roads, plantations and natural forest to within one slide. For 1964 the 2022-checked inventory gives 70 slides dated to the 1964–65 storms, against 72. 21 of the 36 slides of 1996 are flagged as becoming debris flows, against 16 published, and the open data does not resolve that difference.
- Debris slides, 199636 slides → 36 slides 0match
- … related to roads17 slides → 16 slides −1.0 slides (−5.9%)within tolerance
- … in plantations3 slides → 4 slides +1.0 slides (+33.3%)within tolerance
- … in natural forest16 slides → 16 slides 0match
- Became debris flows, 1996 (unresolved)16 slides → 21 slides +5.0 slides (+31.3%)explained why
- Debris slides, 1964 (2022-checked inventory, original dates)72 slides → 70 slides −2.0 slides (−2.8%)explained why
- … related to roads, 196440 slides → 35 slides −5.0 slides (−12.5%)explained why
- … in plantations, 196417 slides → 15 slides −2.0 slides (−11.8%)explained why
- … in natural forest, 196415 slides → 20 slides +5.0 slides (+33.3%)explained why
[7, 8]
[17]
[42, 43]
Numbers in brackets, like [14], are step numbers in this study's run.json: the NativeGIS call that returned the figure. NativeGIS 0.3.0, recorded 2026-10-31 15:31 UTC.
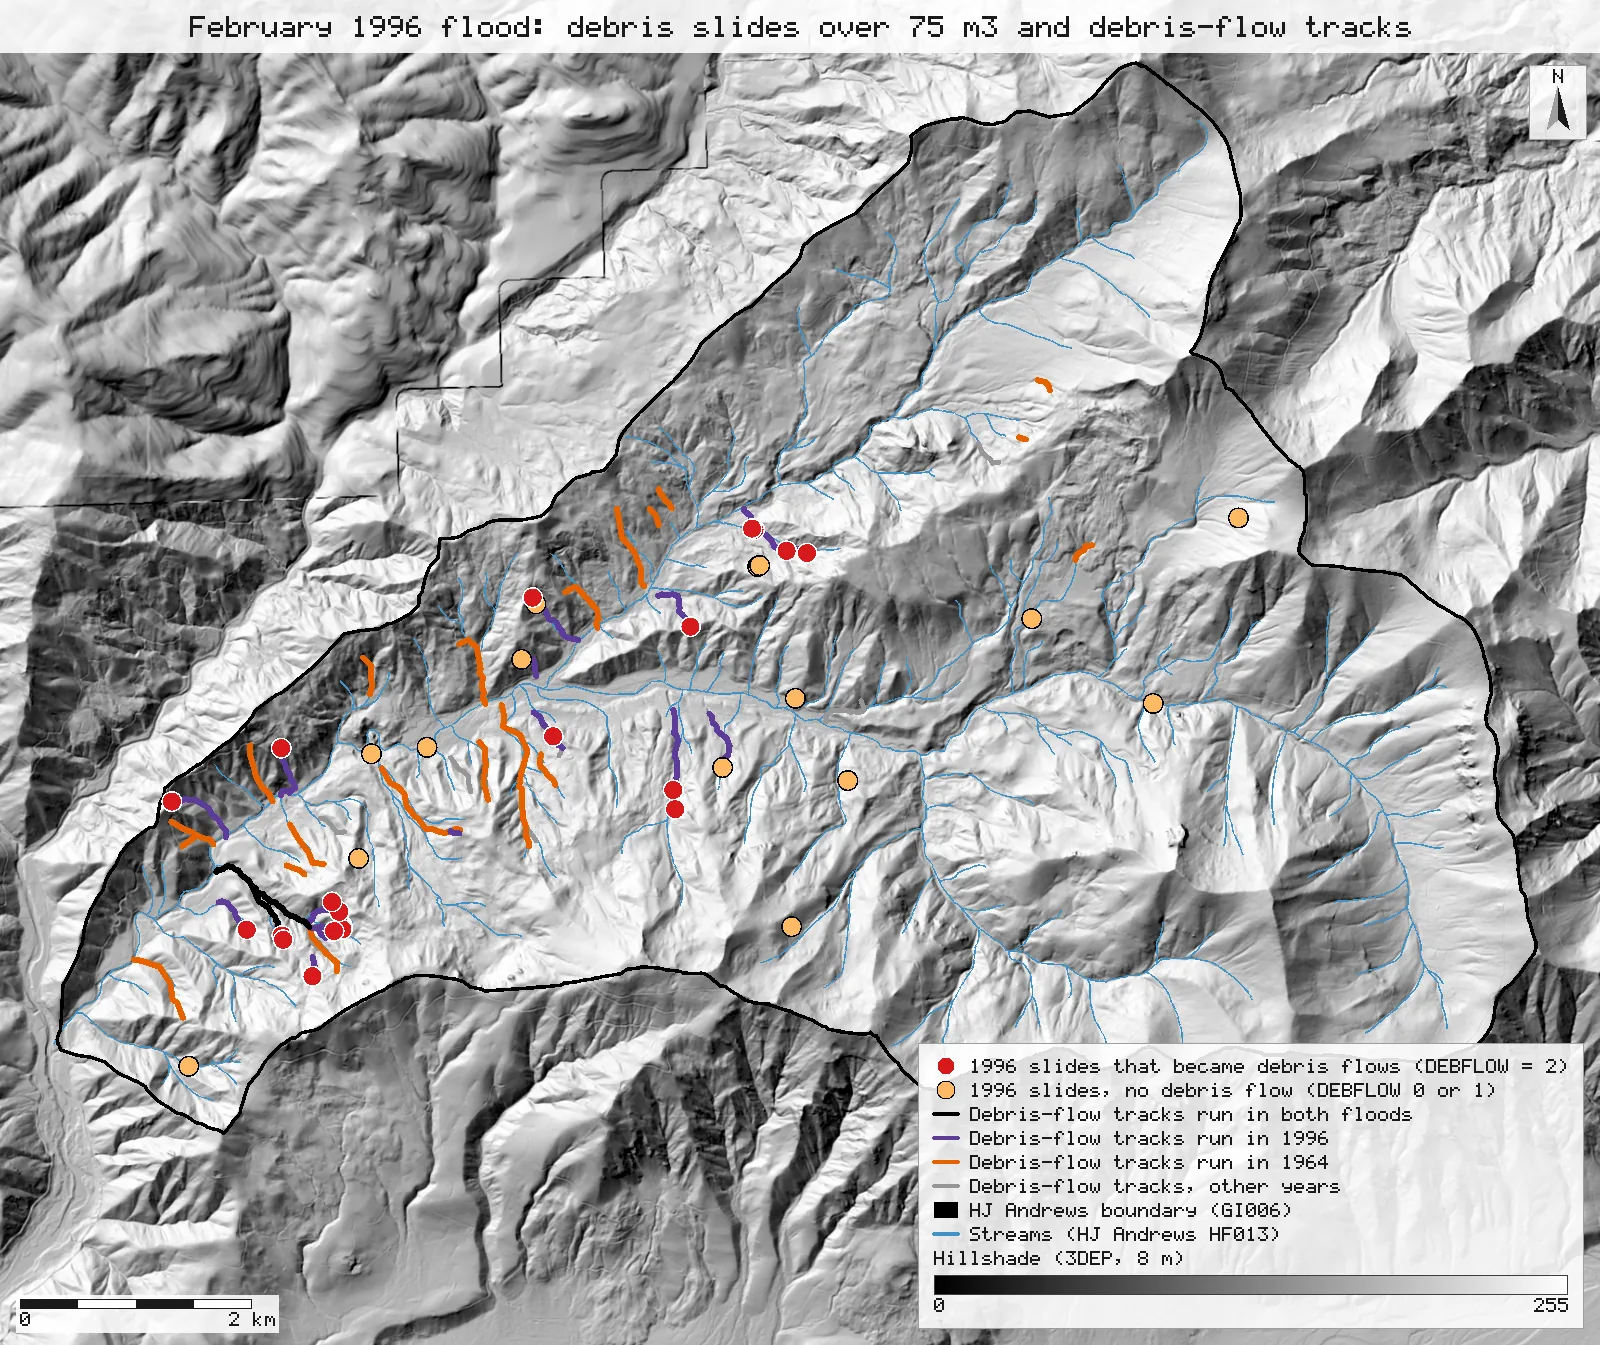
Click or tap a map to open it full screen, then zoom and pan.
What was published
The paper inventoried the debris slides and debris flows of the February 1996 storm in the Blue River basin, which takes in Lookout Creek and the Andrews, with a 100 yd³ (75 m³) minimum for comparison with the 1964–65 inventories. Its mass-movement findings: "A total of 36 debris slides larger than 75 m3 were observed following the 1996 event in the H.J. Andrews Experimental Forest, compared with 72 in the same area following the 1964 flood." By origin: 16 slides in natural, post-wildfire forest in 1996 (15 in 1964), 3 in post-clearcut plantations (17 in 1964) and 17 related to roads (40 in 1964). And: "Of the 36 slides in 1996, 16 resulted in debris flows down 8 separate channels."
Andrews Forest catalogue entry · Scanned paper (PDF)
Published method. Ground searches of the whole road network and of fourth-order and larger channels, all debris-flow tracks followed, aerial reconnaissance and 1:12,000 post-flood photographs, with a field subsample of first- to third-order channels. The 1964 figures are from Swanson & Dyrness (1975) and Marion (1981).
The data and where it came from
All of it is open: downloaded without an account or a form.
| Data | Where | Licence |
|---|---|---|
| GE012 landslide inventory 1953–1996 (slide_inv_all2.shp, NAD83 / UTM 10N): the 1996 points are Wallenstein's inventory (INV = W); the 1964–65 points are Dyrness's (D) and Swanson's (S). VOLMETER is the slide volume in m³, DEBFLOW whether a debris flow resulted | HJ Andrews LTER, 202 kB zip, no form or account https://andrewsforest.oregonstate.edu/sites/default/files/lter/data/studies/spatialdata/ge01201.zip | CC BY 4.0 (EDI record for GE012) |
| GE012 Lookout Creek landslide inventory (slide_inv_lookout.shp, NAD83 / UTM 10N), its locations and attributes checked and corrected in 2022: Dyrness (D), Swanson (S) and Wallenstein (W) points 1953–2014, with YEAR_OR (the original date text), YEAR (one year the inventory assigns), LANDUSE_1 (R road, C cut, F forest), VOLMETER (m³) and DEBFLOW | HJ Andrews LTER, 457 kB zip, no form or account https://andrewsforest.oregonstate.edu/sites/default/files/lter/data/studies/spatialdata/ge01202.zip | CC BY 4.0 (EDI record for GE012) |
| GE012 debris-flow tracks (debrisflows_220913.shp, NAD83 / UTM 10N): 67 channel reaches with the flood Date and the SLIDE_ID of the slides that fed them | HJ Andrews LTER, 252 kB zip, no form or account https://andrewsforest.oregonstate.edu/sites/default/files/lter/data/studies/spatialdata/ge01203.zip | CC BY 4.0 (EDI record for GE012) |
| GI006 HJ Andrews Experimental Forest boundary (boundary83.shp) | HJ Andrews LTER, zip, no form or account https://andrewsforest.oregonstate.edu/sites/default/files/lter/data/studies/spatialdata/gi00601.zip | HJ Andrews data policy (CC BY, acknowledgement requested) |
| USGS 3DEP elevation, exported as an 8 m DEM (32-bit float GeoTIFF, NAD83 UTM zone 10N) for the map window; used only for the map's hillshade | USGS National Map 3DEP elevation image service (exportImage), no form or account https://elevation.nationalmap.gov/arcgis/rest/services/3DEPElevation/ImageServer | US federal data, public domain |
| HJ Andrews stream network (HF013, hydro.shp), NAD83 UTM zone 10N; drawn on the map only | HJ Andrews LTER, zip, no form or account https://andrewsforest.oregonstate.edu/sites/default/files/lter/data/studies/spatialdata/hf01301.zip | HJ Andrews data policy (CC BY, acknowledgement requested) |
The input files the run read, pinned by checksum
| File (relative to the data folder) | Bytes | sha256 |
|---|---|---|
samples/hja-open/gi00601/x/boundary83.shp | 10,540 | 0774de0a9ebd9693… |
samples/hja-open/ge01201/x/slide_inv_all2.shp | 9,480 | 876220d16d25c000… |
samples/hja-open/ge01202/x/slide_inv_lookout.shp | 5,224 | 46175d3f25916f8b… |
samples/hja-open/ge01203/x/debrisflows_220913.shp | 10,428 | bb5ccc9f4f401084… |
samples/dem3dep/lookout_creek_26910_8m.tif | 11,930,186 | de869b30bf1a2161… |
samples/hja-open/hf01301/x/hydro.shp | 173,308 | 263271acd998f7bd… |
Full checksums are in run.json. Replay refuses an input whose checksum differs.
Method
- Open GE012 (the 1996 inventory file, slide_inv_all2) and select the 1996 slides (YEAR = 1996) in the Lookout Creek basin (BASIN = LO) larger than 75 m³ (VOLMETER, a text field compared as a number), then keep those inside the Andrews boundary.
- Count them by LANDUSE_1 (R road, F forest, S stream, C cut) and by DEBFLOW (2 a debris flow resulted, 1 debris reached a channel but was not carried on, 0 no).
- For 1964: open the 2022-checked Lookout Creek inventory (slide_inv_lookout), keep the points inside the boundary whose original date text (YEAR_OR) names the 1964–65 storms (1964, 64-65, 63-65 or Dec-64), and count them by volume, inventory and land use. Count the inventory's assigned YEAR = 1964 as well, for comparison only. Repeat the 1964 count on the 1996 file (YEAR 1964, 64-65 or 12/64), and look for the same slide in both inventories there (a Swanson point within 50 or 100 m of a Dyrness point).
- Cross-check 1996 in the 2022-checked inventory: YEAR 1996, over 75 m³, inside the boundary, by inventory, land use and DEBFLOW.
- Debris-flow tracks: clip to the boundary and measure the length run in each flood; join the 1996 reaches whose ends meet into separate systems. Join the 1996 slides to the nearest 1996 track within 50 m.
- Render the map as SVG over a hillshade of an 8 m USGS 3DEP DEM, with the HJ Andrews streams; record the run and replay it in a fresh session.
The run made 81 NativeGIS calls: gis_open × 6, gis_process × 24, gis_query × 48, gis_close × 1, gis_render × 2.
Published numbers next to ours
| Measure | Published | NativeGIS | How NativeGIS got it |
|---|---|---|---|
| Debris slides over 75 m³, 1996 | 36 | 36 | YEAR = 1996, BASIN = LO, VOLMETER > 75: 36 [7], all inside the boundary [8]. GE012 holds 92 slides of 1996 [4], 39 in Lookout Creek [5]; 80 of the 92 are over 75 m³ [6], and 36 of those lie inside the Andrews [10] |
| … related to roads | 17 | 16 | LANDUSE_1 = R [11] |
| … in post-clearcut plantations | 3 | 4 | LANDUSE_1 = C [14] |
| … in natural, post-wildfire forest | 16 | 16 | LANDUSE_1 = F, 9 [12], plus S (stream), 7 [13] |
| Became debris flows, 1996 | 16 | 21 | DEBFLOW = 2 ("yes") [17]; 6 more are DEBFLOW = 1 [20] and 9 are 0 [21]. 20 of the 21 lie within 50 m of a 1996 track [74] (21 of all 36 [73]) |
| Channels the 1996 debris flows ran down | 8 | 16 | The 30 reaches of 1996 track joined where their ends meet within 5 m (gis_process explode with connect): 16 separate systems [61]; within 50 m: 13 [62]. Not the same measure: see the differences |
| Debris slides, 1964 (2022-checked inventory) | 72 | 70 | GE012 slide_inv_lookout inside the boundary [39] whose original date text (YEAR_OR) is 1964, 64-65, 63-65 or Dec-64 [42]: Dyrness 44 [44], Swanson 26 [45]; 69 are over 75 m³ [43]. By the inventory's assigned YEAR, which also places wider ranges in 1964: 82 [40] |
| … related to roads | 40 | 35 | [46] |
| … in plantations | 17 | 15 | [47] |
| … in natural forest | 15 | 20 | [48] |
| Debris slides, 1964 (1996 inventory file, GE01201) | 72 | 66 | Lookout Creek points dated 1964, 64-65 or 12/64, inside the boundary [24], all over 75 m³ [25]: Dyrness 44 [26], Swanson 22 [27]; road 34, cut 12, forest 20 [28, 29, 30, 31]. 2 more Dyrness points have no year or basin [33]. Swanson points near a Dyrness point: 1 within 50 m [36], 3 within 100 m [37] |
| Debris slides over 75 m³, 1996 (2022-checked inventory) | 36 | 38 | YEAR 1996, VOLMETER over 75 m³, inside the boundary [50]: Wallenstein 36 [51] and 2 Swanson points added since [52]; road 17, plantation 4, forest 17 [53, 54, 55]; DEBFLOW = 2 on 21 [56]. 183 points of all years in the Andrews [39] |
Units: counts of GE012 inventory points; volumes are VOLMETER in m³. The paper's minimum is 100 yd³, which it gives as 75 m³ (100 yd³ is 76.46 m³, and slides of exactly 100 yd³ are stored as 76.46, so they count under either threshold).
Debris-flow tracks inside the Andrews
| Tracks | Length |
|---|---|
| Run in 1996 (37 reaches, dissolved) | 8.19 km [60] |
| … only in 1996 | 6.22 km [66] |
| Run in 1964 | 10.84 km [64] |
| … only in 1964 | 8.10 km [68] |
| Run in both floods | 1.56 km [70] |
| Other years | 2.45 km [72] |
| All tracks | 19.93 km [58] |
Lengths in m in NAD83 / UTM zone 10N (EPSG:26910). The paper gives no track lengths; they are here as context for the map.
Why any numbers differ
- The 1996 count matches. 36 slides of 1996 in Lookout Creek are larger than 75 m³, and all 36 lie inside the Andrews boundary. The 2022-checked inventory holds 38: the same 36 plus 2 Swanson points added since.
- The 1996 origins agree to within one slide. 16 started at roads (published 17) and 4 in clearcuts (published 3 in plantations). 9 started in forest and 7 at streams: together 16, the paper's number for natural, post-wildfire forest. The 2022-checked inventory has folded the stream class into forest, which supports reading the stream-origin slides as natural forest; with its 2 added points it gives 17 road, 4 plantation and 17 forest.
- The debris-flow count differs, and stays unresolved. DEBFLOW = 2 ("yes") is set on 21 of the 36, against 16 published; 6 more are DEBFLOW = 1, debris that reached a channel but was not carried on. 20 of the 21 lie within 50 m of a 1996 debris-flow track. The 2022 check of the inventory still carries DEBFLOW = 2 on 21 slides. No field or combination of fields in the open data gives 16, so it cannot say whether the paper counted fewer slides as debris flows or the coding changed after it was written.
- The 1964 count comes out 2 short. In the 2022-checked inventory, 70 points in the Andrews carry an original date naming the 1964–65 storms (44 from Dyrness, 26 from Swanson; 69 of them over 75 m³), against 72. Dyrness (1967) counted 47 events, 3 more than the file holds, and 72 less 47 leaves 25 for the other inventories, against 26 Swanson points here, so the gap is about the three Dyrness events missing from the file. The inventory's assigned YEAR puts 82 slides in 1964, because it also places wider ranges such as 59-67 there; only the slides whose original date names the storms are counted. The 1996 inventory file gave 66 (44 from Dyrness, 22 from Swanson).
- The 1964 origins differ. The paper splits its 72 into 40 road, 17 plantation and 15 forest slides. The 2022-checked inventory gives 35 road, 15 plantation and 20 forest: five fewer from roads and five more in forest. The open file does not say how the paper assigned each 1964 slide's origin, so it cannot show which slides moved.
- The open tracks do not give 8 channels. The 1996 debris-flow tracks are 30 separate reaches in the track file. Joining reaches whose ends meet (gis_process explode with connect) gives 16 separate track systems when ends within 5 m count as meeting, and 13 within 50 m. It takes gaps of several hundred metres to reach 8, so the paper's 8 channels most likely counts the channels the flows ran into rather than separate tracks. The 1996 tracks total 8.2 km inside the Andrews (6.2 km run only in 1996, 1.6 km in both floods); the 1964 tracks total 10.8 km.
Replay it yourself
The run file records every call, its arguments, the checksums of the files it read and the numbers it returned. Replaying it repeats every call in a fresh NativeGIS session and checks that each answer comes out the same.
- Make an empty data folder and fetch the inputs into it exactly as below (bash; the folder layout is the one the run file expects):
cd /path/to/an/empty/folder
mkdir -p samples/hja-open/ge01201 && curl -fL -o samples/hja-open/ge01201/ge01201.zip https://andrewsforest.oregonstate.edu/sites/default/files/lter/data/studies/spatialdata/ge01201.zip && unzip -o samples/hja-open/ge01201/ge01201.zip -d samples/hja-open/ge01201/x
mkdir -p samples/hja-open/ge01202 && curl -fL -o samples/hja-open/ge01202/ge01202.zip https://andrewsforest.oregonstate.edu/sites/default/files/lter/data/studies/spatialdata/ge01202.zip && unzip -o samples/hja-open/ge01202/ge01202.zip -d samples/hja-open/ge01202/x
mkdir -p samples/hja-open/ge01203 && curl -fL -o samples/hja-open/ge01203/ge01203.zip https://andrewsforest.oregonstate.edu/sites/default/files/lter/data/studies/spatialdata/ge01203.zip && unzip -o samples/hja-open/ge01203/ge01203.zip -d samples/hja-open/ge01203/x
mkdir -p samples/hja-open/gi00601 && curl -fL -o samples/hja-open/gi00601/gi00601.zip https://andrewsforest.oregonstate.edu/sites/default/files/lter/data/studies/spatialdata/gi00601.zip && unzip -o samples/hja-open/gi00601/gi00601.zip -d samples/hja-open/gi00601/x
mkdir -p samples/dem3dep && curl -fL -o samples/dem3dep/lookout_creek_26910_8m.tif 'https://elevation.nationalmap.gov/arcgis/rest/services/3DEPElevation/ImageServer/exportImage?bbox=558400,4891600,572400,4904600&bboxSR=26910&imageSR=26910&size=1750,1625&format=tiff&pixelType=F32&noData=-9999&interpolation=RSP_BilinearInterpolation&compression=None&f=image'
mkdir -p samples/hja-open/hf01301 && curl -fL -o samples/hja-open/hf01301/hf01301.zip https://andrewsforest.oregonstate.edu/sites/default/files/lter/data/studies/spatialdata/hf01301.zip && unzip -o samples/hja-open/hf01301/hf01301.zip -d samples/hja-open/hf01301/x
- Download run.json (105,941 bytes, sha256
7e605bf6f758f9425dd939bde6e89504308c163acf613a7f45697d97f9e9d3fd). - Ask your assistant to replay it with NativeGIS, or call the tool directly:
gis_replay {"action": "replay",
            "file": "<absolute path to the run.json you downloaded>",
            "inputRoot": "<your data folder>",
            "outputRoot": "<a new, empty folder>"}
Paths in the run file are relative to the data folder (inputRoot), and outputs go under outputRoot, so nothing depends on where the original run lived.
Files
- run.json: the recorded run: every call, its arguments and the numbers it returned
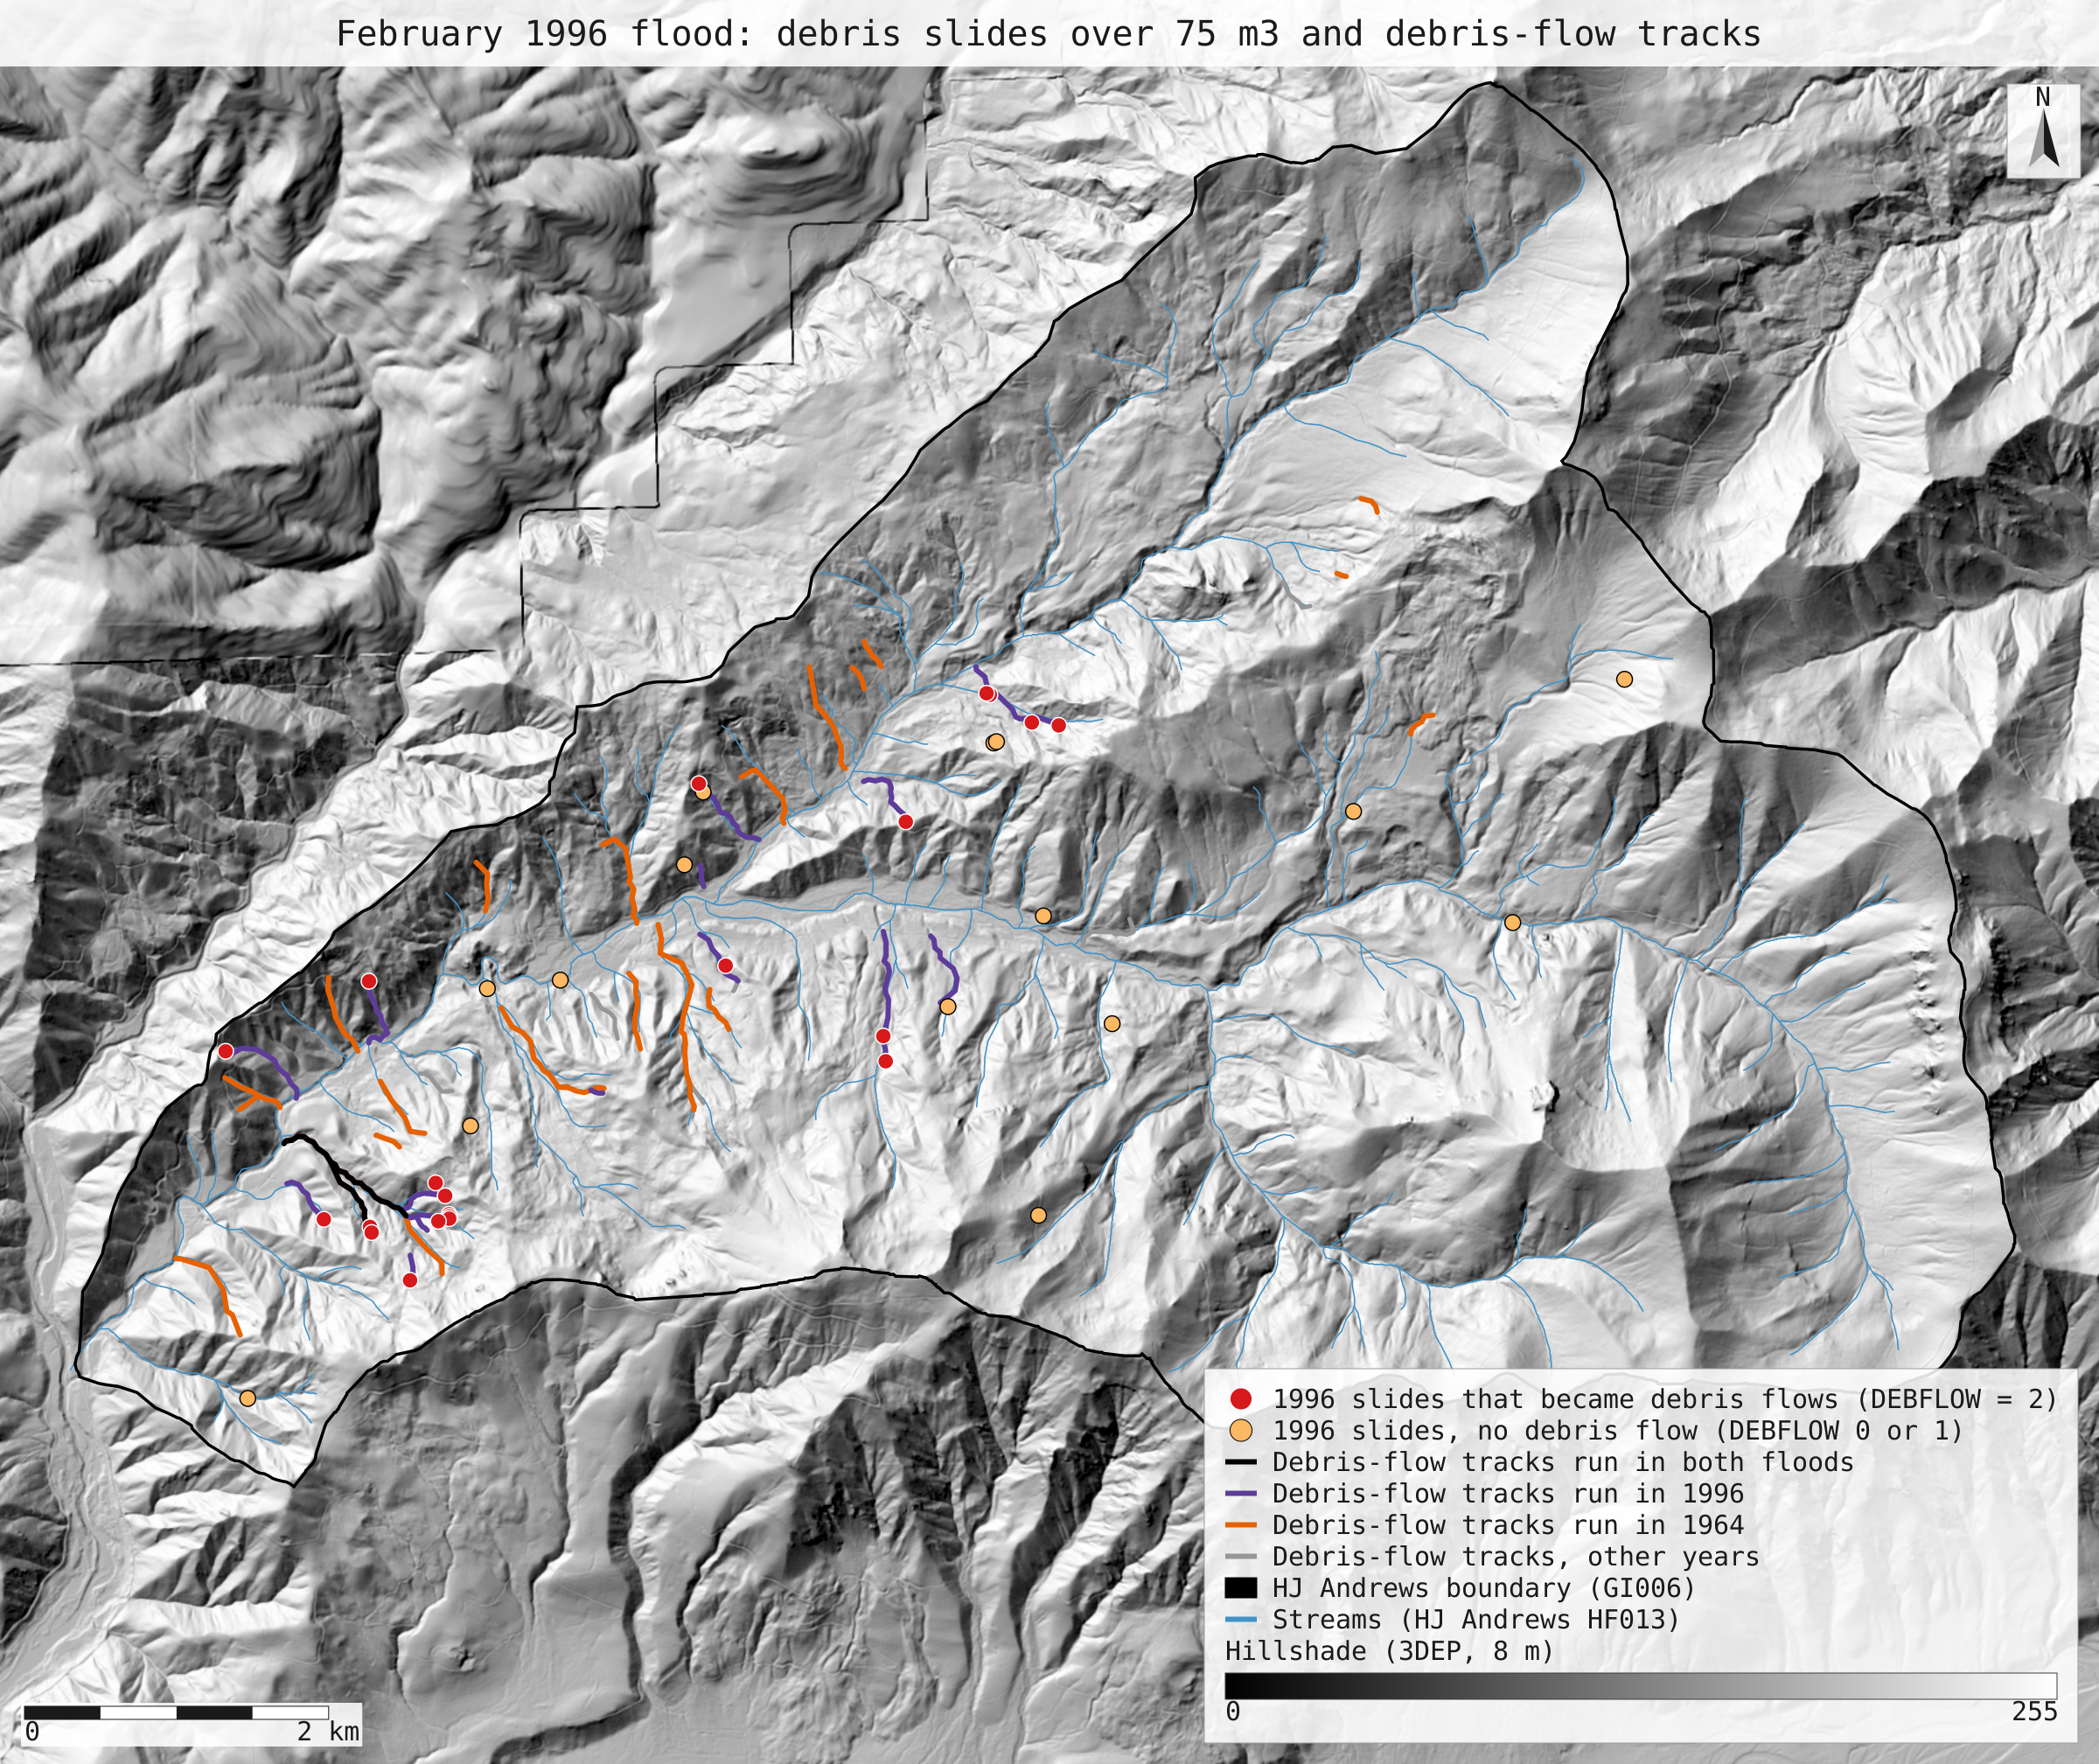
- flood_1996_slides_tracks.svg: the full-detail map
Limits
- The 1996 inventory file (GE01201) keeps Wallenstein's 1996 inventory as it was coded then; the 2022-checked inventory (GE01202) covers Lookout Creek only and keeps the same DEBFLOW coding.
- The inventory points were screen-digitised from field maps, so each locates a slide to within tens of metres. The track join uses a 50 m search for that reason.
- VOLMETER is stored as text; NativeGIS compares it as a number in the query, so a value such as "100.00" counts as 100 m³.
- The slides of 1996 smaller than 75 m³ (3 in Lookout Creek) are left out, as in the paper.