Roads and clearcuts in Lookout Creek, 1950–1995
From the open HJ Andrews layers, 13.3% of the Lookout Creek basin was cut by 1964 (published 13%), it holds 122 km of road (published 119 km), and the road right of way covers 3.9% (published 3.7%); the road construction history puts 89.9 km of road in place by 1964 (published 94 km). The harvest total comes out 2 points lower, the published 71.3% native forest is the paper's own subtraction, and the slide counts differ because only an older inventory is open.
- Cut by November 196413% → 13.3% +0.3 ptsmatch
- Clearcut by 199525% → 22.9% −2.1 ptswithin tolerance
- Road length by 1995119 km → 122.0 km +3.0 km (+2.5%)within tolerance
- Road built by November 1964 (DH001 road history, built by 1964)94 km → 89.9 km −4.1 km (−4.3%)explained why
- Road length, DH001 road history (built up to 1989)119 km → 115.8 km −3.2 km (−2.7%)within tolerance
- Road right of way3.7% → 3.88% +0.2 ptswithin tolerance
- Native forest, the paper's arithmetic (100 − clearcut − right of way) on the open layers; basis changed: the reprint shows 71.3 = 100 − 25 − 3.771.3% → 73.20% +1.9 ptsexplained why
- Native forest, each square metre counted once (not the paper's accounting)71.3% → 75.19% +3.9 ptsexplained why
[33, 34, 3]
[8]
[14, 3]
Numbers in brackets, like [14], are step numbers in this study's run.json: the NativeGIS call that returned the figure. NativeGIS 0.3.0, recorded 2026-10-31 16:18 UTC.
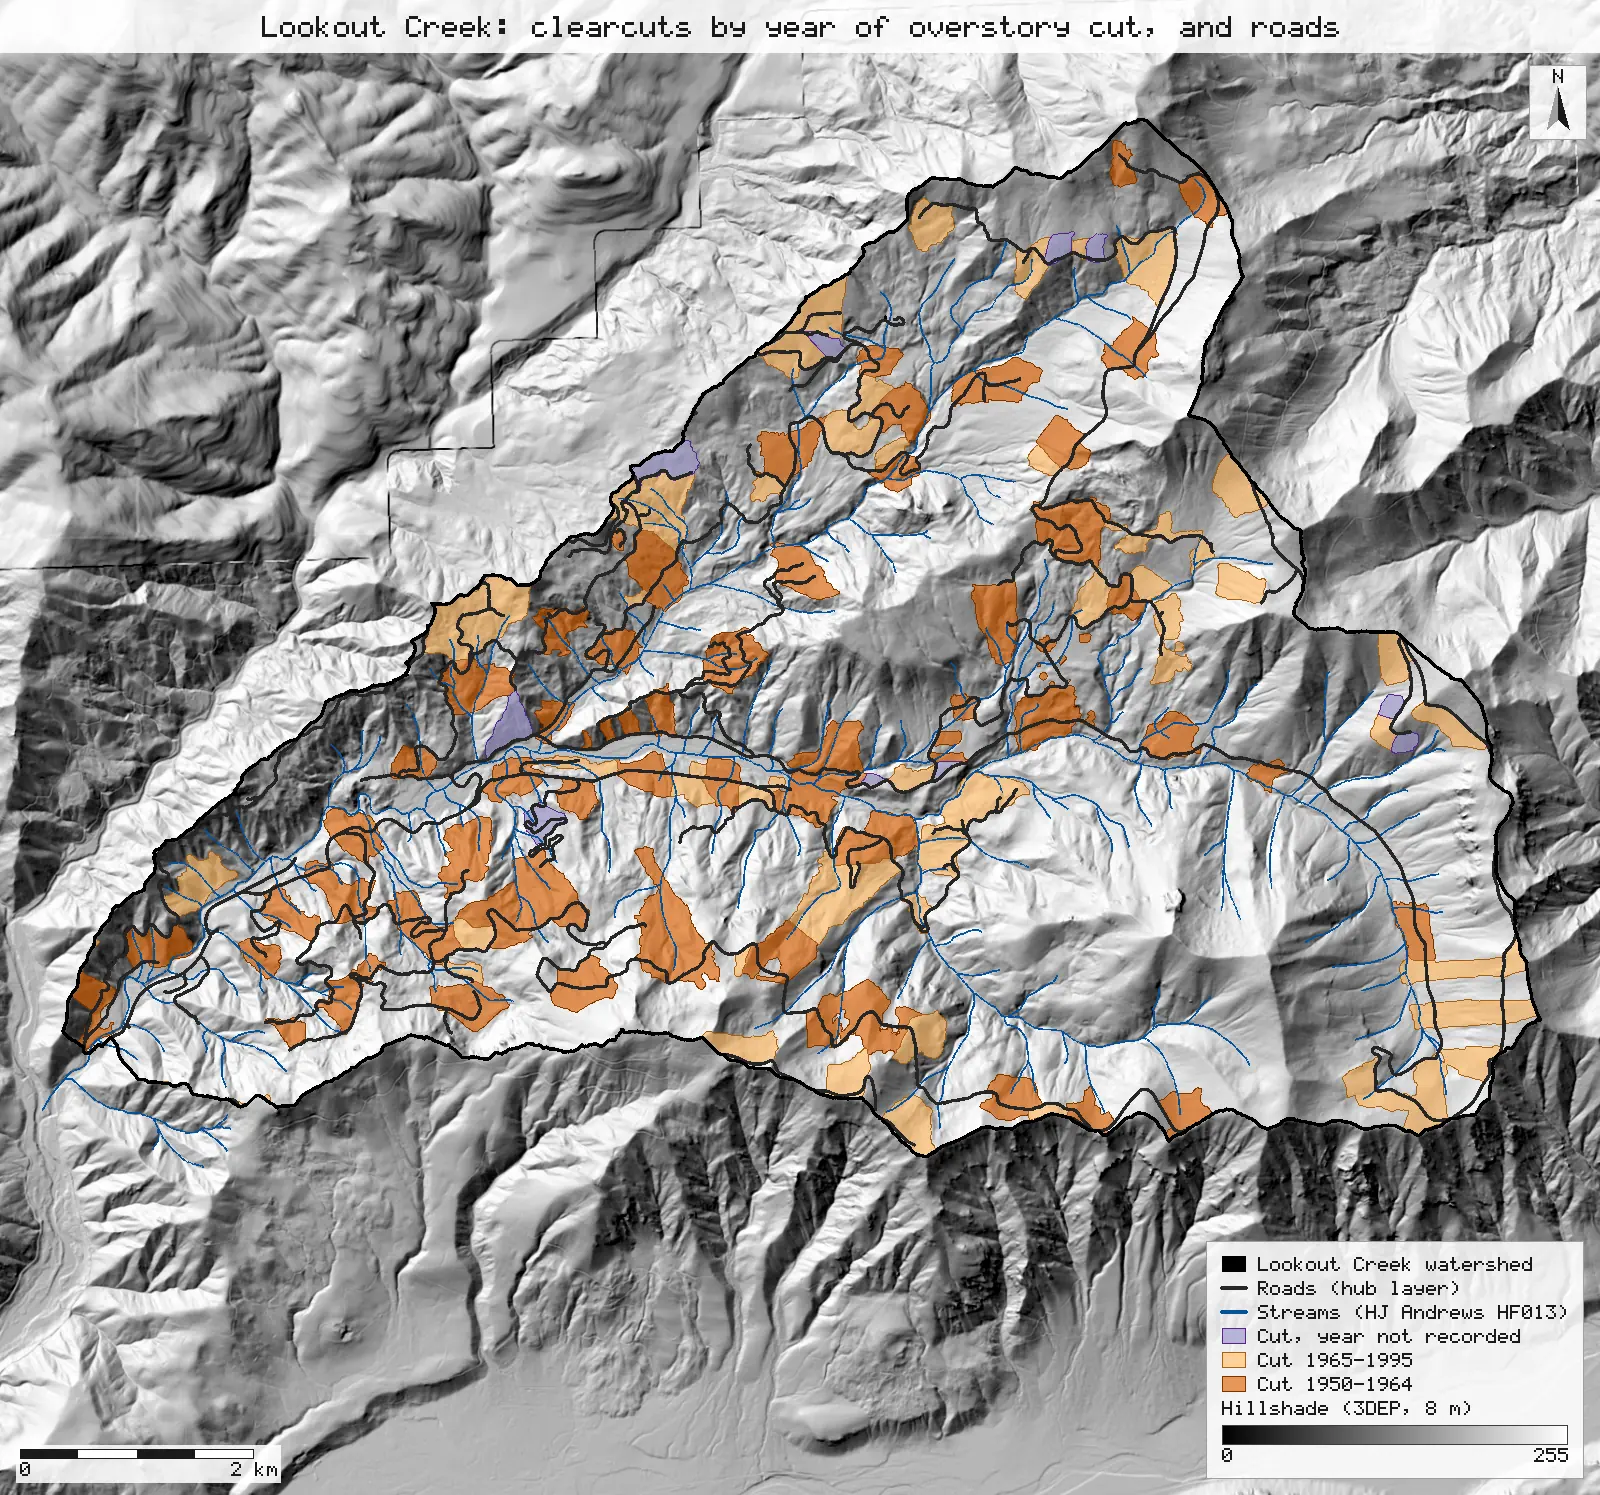
Click or tap a map to open it full screen, then zoom and pan.
What was published
The paper traces 70 years of road building, clearcutting, floods and landslides in the 64 km² Lookout Creek basin. Its land-use figures: "by 1995 there were 119 km of roads and 25% of the watershed had been clearcut"; roads occupy 3.7% of the area and native forest 71.3% (§2 Study site, reprint p. 2; repeated in §4.4, p. 7). "By November 1964, 13% of the area upstream of LOL" (the lower Lookout reach) had been clearcut (§4.1, p. 5). Table 2 (p. 6) counts debris slides per period: 32 (1950–Nov 1964), 82 (Dec 1964–Jan 1965), 27 (Feb 1965–1995), 41 (1996) and 1 (1997–2020), from the landslide inventory as updated in 2014 (Swanson 2014). A slide counts as road-related when it occurred within 10 m of a road centreline, "an area which encompasses the cutslope, fillslope, and road surface" (§3.1, p. 4–5); §4.2 calls the same 10 m zone either side of the centreline the road right of way.
Article (doi:10.1002/esp.5537) · HJ Andrews reprint (PDF)
Published method. The authors compiled historical land use from the HJ Andrews spatial data (H.J. Andrews Experimental Forest 2019) and the landslide inventory, with road-related slides defined as those within 10 m of a road. The 119 km and 25% come from Jones & Grant (1996); the 3.7% from Wemple et al. (1996). Table 2 also gives road length per period (94, 11 and 21 km, which add to 126 km, not 119).
The data and where it came from
All of it is open: downloaded without an account or a form.
| Data | Where | Licence |
|---|---|---|
| Gauged watershed boundaries (2018) from the 1 m LiDAR DEM, including Lookout Creek (Wshed_Name = Lookout). Hydrology service, layer 5, as GeoJSON in EPSG:4326 | Oregon State University / HJ Andrews open-data hub, anonymous REST query, fetched 2026-10-30 https://services1.arcgis.com/CD5mKowwN6nIaqd8/arcgis/rest/services/HJ_Andrews_Hydrology__2018_/FeatureServer/5 | HJ Andrews data policy (CC BY, acknowledgement requested) |
| HJA roads: the Andrews road network as re-digitised from the 2008 LiDAR DEM. Base layers service, layer 6 | Oregon State University / HJ Andrews open-data hub, anonymous REST query, fetched 2026-10-30 https://services1.arcgis.com/CD5mKowwN6nIaqd8/arcgis/rest/services/HJ_Andrews_Base_GIS_Layers__2018/FeatureServer/6 | HJ Andrews data policy (CC BY, acknowledgement requested) |
| Road construction history 1952-1990 (DH001, roads_history.shp, NAD83 / UTM zone 10N): road centrelines around the Andrews with the year each was built (YEAR) | HJ Andrews LTER, 467 kB zip, no form or account https://andrewsforest.oregonstate.edu/sites/default/files/lter/data/studies/spatialdata/dh00101.zip | HJ Andrews data policy (CC BY, acknowledgement requested) |
| Harvest sites: historical harvest units with the year of the overstory cut (OVRSTRY_YR) and the stand's year of origin (YR_ORIGIN). Land cover / land use service, layer 0 | Oregon State University / HJ Andrews open-data hub, anonymous REST query, fetched 2026-10-30 https://services1.arcgis.com/CD5mKowwN6nIaqd8/arcgis/rest/services/HJ_Andrews_LCLU__2018/FeatureServer/0 | HJ Andrews data policy (CC BY, acknowledgement requested) |
| GE012 landslide inventory 1953–1996 (slide_inv_all2.shp, NAD83 / UTM 10N): inventories by Dyrness, Swanson, Marion and Wallenstein | HJ Andrews LTER, 202 kB zip, no form or account https://andrewsforest.oregonstate.edu/sites/default/files/lter/data/studies/spatialdata/ge01201.zip | CC BY 4.0 (EDI record for GE012) |
| USGS 3DEP elevation, exported as an 8 m DEM (32-bit float GeoTIFF, NAD83 UTM zone 10N) for the maps' window; used only for the maps' hillshade | USGS National Map 3DEP elevation image service (exportImage), no form or account; two exports gave the same sha256 https://elevation.nationalmap.gov/arcgis/rest/services/3DEPElevation/ImageServer | US federal data, public domain |
| HJ Andrews stream network (HF013, hydro.shp), NAD83 UTM zone 10N; drawn on the maps only | HJ Andrews LTER, zip, no form or account https://andrewsforest.oregonstate.edu/sites/default/files/lter/data/studies/spatialdata/hf01301.zip | HJ Andrews data policy (CC BY, acknowledgement requested) |
The input files the run read, pinned by checksum
| File (relative to the data folder) | Bytes | sha256 |
|---|---|---|
samples/goodman-2023/hub/gauged_watersheds.geojson | 1,645,111 | 8bc4453fe3897657… |
samples/goodman-2023/hub/roads.geojson | 727,664 | 6c913bf70d2c68df… |
samples/hja-open/dh00101/x/roads_history.shp | 384,572 | 738e501d8e90e953… |
samples/goodman-2023/hub/harvest_sites.geojson | 635,270 | abfe5b7ef269f51d… |
samples/goodman-2023/ge01201/x/slide_inv_all2.shp | 9,480 | 876220d16d25c000… |
samples/dem3dep/lookout_creek_26910_8m.tif | 11,930,186 | de869b30bf1a2161… |
samples/hja-open/hf01301/x/hydro.shp | 173,308 | 263271acd998f7bd… |
Full checksums are in run.json. Replay refuses an input whose checksum differs.
Method
- Open the gauged watersheds, select Lookout and reproject it to NAD83 / UTM zone 10N (EPSG:26910, metres), the CRS the hub layers are stored in. Every area and length below is measured in it.
- Roads: reproject, clip to the watershed and measure the length, also by the layer's type code. Buffer the clipped roads by 10 m (the paper's right of way, §3.1 and §4.2), dissolve, clip to the watershed and measure the area.
- Road history: clip the DH001 road centrelines to the watershed, measure each piece and sum the length by the period its YEAR falls in (built before 1950, 1950–1964, 1965 or later, no year) (clip, fieldCalc, summarize).
- Harvest: reproject, clip to the watershed and dissolve, so overlapping units count once. Then select the units by OVRSTRY_YR (the year of the overstory cut): 1950–1964, 1965 or later, and 0 (not recorded), and dissolve each. Repeat 1950–1964 with YR_ORIGIN for comparison.
- Native forest, two ways: the paper's arithmetic (100% minus the clearcut share minus the right-of-way share, from the run's areas), and each square metre once: the watershed minus the harvest units minus the road right of way (difference).
- Slides: clip the GE012 points to the watershed and sort them into the paper's periods by the YEAR text, counting those from roads (LANDUSE_1 = R) and from roads or clearcuts (R or C).
- Render the two maps as SVG over a hillshade of an 8 m USGS 3DEP DEM, with the HJ Andrews streams; record the run and replay it in a fresh session.
The run made 69 NativeGIS calls: gis_open × 7, gis_query × 27, gis_process × 31, gis_render × 4.
Published numbers next to ours
Roads, clearcuts and native forest
| Measure | Published | NativeGIS | How NativeGIS got it |
|---|---|---|---|
| Area cut by November 1964 | 13% §4.1 | 13.3% 832 ha | Harvest units with an overstory cut year (OVRSTRY_YR) of 1950–1964, n = 84 units, dissolved [33, 34] |
| … using YR_ORIGIN instead | 13% | 11.6% 724 ha | Units whose stand origin year is 1950–1964, n = 56 [40, 41]. YR_ORIGIN is when the new stand was certified, often years after the cut, so this undercounts. |
| Area cut 1965–1995 | 2% (Dec 1964–Jan 1965) + 10% (Feb 1965–1995) Table 2 | 8.7% 546 ha | OVRSTRY_YR 1965 or later, n = 66 [35, 36] |
| Cut, year not recorded | – | 0.8% 53 ha | OVRSTRY_YR 0 (no data), n = 10 [37, 38] |
| Clearcut by 1995 | 25% §2 | 22.9% 1,432 ha | All 160 harvest-unit pieces inside the watershed, dissolved so overlaps count once [30, 32] |
| Roads by 1995 | 119 km §2 | 121.99 km | Road centrelines clipped to the watershed, 112 pieces [8]; the whole layer is 125.89 km [7] |
| Roads (right of way) | 3.7% §2, §4.4 | 3.9% 242 ha | 10 m either side of the centreline, dissolved and clipped to the watershed [13, 14]. 1.9% of the basin is right of way outside harvest units [42]. |
| Native forest, the paper's arithmetic | 71.3% §2, §4.4: 100 − 25 − 3.7 | 73.2% | 100% minus the clearcut share minus the right-of-way share, as the paper's figures add up; the right of way inside clearcuts is subtracted twice [32, 14, 3] |
| Native forest, each square metre once | – | 75.19% 4,696 ha | Watershed minus harvest units minus road right of way, by polygon overlay [44, 46] |
| Road built by November 1964 | 94 km, 75% of the network Table 2 | 89.91 km 78% of DH001's roads in the watershed | DH001 road construction history clipped to the watershed: built 1950–1964 87.52 km and before 1950 2.39 km, 104 pieces [22, 27] |
| Road built after 1964 | 11 + 21 = 32 km Table 2 | 25.84 km | DH001 construction year 1965 or later (its last year is 1989), 43 pieces [27]; 0.02 km carry no year. All DH001 roads in the watershed 115.77 km; the whole layer 220.27 km [21]. |
Area: the Lookout Creek gauged watershed, 6,245.46 ha measured [3] (its own attribute says 6,245.46 ha [5]; the paper says 64 km²). Units: m² and m in NAD83 / UTM zone 10N (EPSG:26910), the CRS the hub layers are stored in; reported as ha, km and % of the watershed. Harvested + right of way outside harvest units + native forest = 100.0%.
Road length by the layer's type code
| type | km in the watershed |
|---|---|
| 1 | 96.21 |
| 2 | 24.43 |
| 3 | 1.35 |
Dissolved by type and measured [10, 12]. The layer's metadata mentions "status code for abandoned roads" but does not say what 1, 2 and 3 mean, so no type is dropped.
Debris slides by period
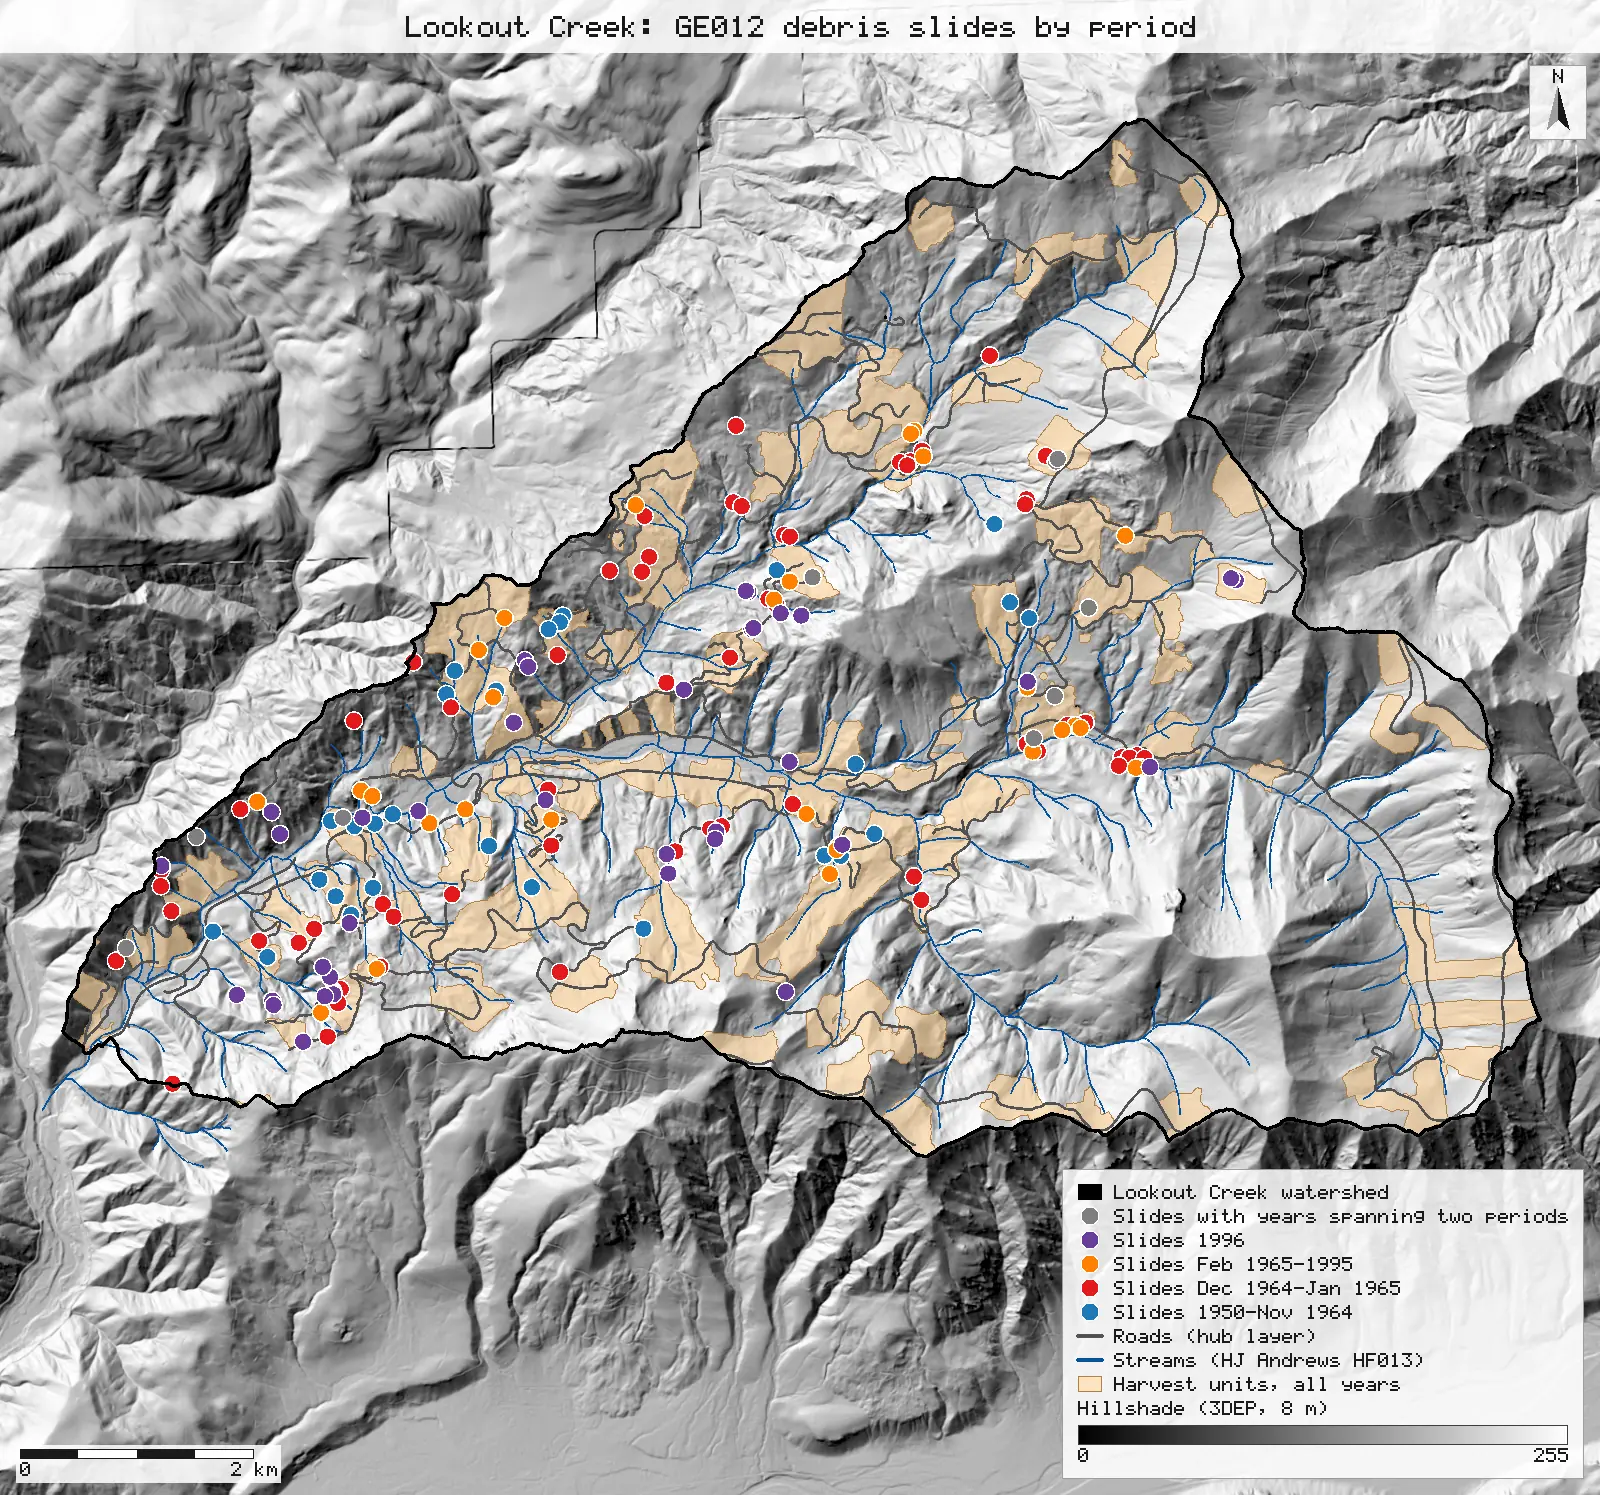
| Period | Published debris slides | GE012 1953–1996 points | Difference | Share from roads or clearcuts |
|---|---|---|---|---|
| 1950-Nov 1964 | 32 | 28 [53] | −4 | From roads: published 56%, NativeGIS 64% [55] |
| Dec 1964-Jan 1965 | 82 | 62 [58] | −20 | From roads and clearcuts: published 70%, NativeGIS 68% [61] |
| Feb 1965-1995 | 27 | 29 [63] | +2 | From roads and clearcuts: published 92%, NativeGIS 76% [66] |
| 1996 | 41 | 38 [68] | −3 | From roads and post-clearcut plantations: published 54%, NativeGIS 53% [71] |
| 1997–2020 | 1 | not in this version | ||
| Years span two periods | – | 9 [73] | ||
| No year recorded | – | 7 [77] | ||
| All | 183 | 173 [49] |
Method: GE012 points inside the Lookout watershed polygon (n = 173; 179 carry BASIN = LO [51]), sorted into the paper's periods by the free-text YEAR field. A value goes into a period only when its whole range lies inside it (for example "64-65" is the 1964–65 flood, "55-59" is the first period); ranges such as "59-67" are counted separately. Origin is the inventory's LANDUSE_1 code: R road, C clearcut. Units: counts of inventoried slides. Published counts are Table 2; published origin shares are §4.1–4.4.
What the downloads held
Fetched 2026-10-30: gauged watersheds 10 features [1], roads 118 [6], harvest sites 161 [28]; GE012 335 points [48]. Each hub layer is below its service's 2,000-feature page limit, so one query returned every feature. The hub is a live service: a later download can differ, and replay then refuses the changed file by its checksum.
Why any numbers differ
- Clearcut by 1964 matches. 13.3% of the basin was cut 1950–1964 by the harvest layer's overstory cut year, against the published 13%. Units cut in December 1964 cannot be split off: the layer stores years, not dates. The YR_ORIGIN field gives 11.6%, because its metadata says it is the year the new stand was certified, which "may" come up to 10 years after the cut.
- Road length is close. 122.0 km of the hub road layer lies inside the watershed (125.9 km in the whole layer), against 119 km in the text. The paper's own Table 2 adds to 126 km. The layer was re-digitised from the 2008 LiDAR and carries no construction dates, so it cannot show the network as it stood in 1995 or in 1964. The road layer was not the only source: DH001, HJ Andrews' road construction history, is an anonymous download and gives the year each road was built. 89.9 km of its roads in the watershed were built by the end of 1964 (78% of its 115.8 km), against Table 2's 94 km (75% of 126 km); its total, built up to 1989, is 3% below the text's 119 km. DH001 is digitised separately from the hub layer, so the two do not share lines.
- The right of way is close. 3.9% of the basin lies within 10 m of a road centreline, against 3.7%. 3.7% is from Wemple et al. (1996), whose road-width rule this page does not have.
- Clearcut by 1995 is 2 points low. The harvest units inside the watershed cover 22.9%, against 25%. Some units on the forest's edge fall partly outside the gauged watershed and are cut off. 25% is from Jones & Grant (1996), which may have counted a slightly different area or unit list. DH001 does not close the gap: it is an anonymous download at the same address as the other spatial data (dh00101.zip), but it holds roads with their construction years, not harvest units, so the 25% against 22.9% stays unexplained by open data.
- Native forest is the paper's subtraction; both accountings are given. The paper gives the rest of the basin as roads (3.7%) and "native forest (71.3%)", and 100 − 25 − 3.7 = 71.3 exactly: a subtraction, not a map overlay, with meadows and rock not excluded. The same arithmetic on the open layers gives 100 − 22.9 − 3.9 = 73.2%. Counting each square metre once, the right of way inside clearcut units counted only as clearcut, gives 75.19%: harvest units 22.9%, right of way outside them 1.9%. The two accountings differ by the 2.0% of the basin where the right of way lies inside clearcuts, which the subtraction removes twice.
- Slide counts differ because the open inventory is older. The open GE012 file stops in 1996; the paper used Swanson's 2014 update, for which no open download was found. In the open file, 1996 is close (38 against 41) and February 1965–1995 is close (29 against 27), but the two earliest periods fall short (28 against 32 and 62 against 82). Another 9 slides carry year ranges that straddle a period boundary and 7 carry no year. The shares of slides from roads or clearcuts are within a few points of the published ones for 1964–65 and 1996, higher for the first period and lower for 1965–1995.
Replay it yourself
The run file records every call, its arguments, the checksums of the files it read and the numbers it returned. Replaying it repeats every call in a fresh NativeGIS session and checks that each answer comes out the same.
- Make an empty data folder and fetch the inputs into it exactly as below (bash; the folder layout is the one the run file expects):
cd /path/to/an/empty/folder
mkdir -p samples/goodman-2023/hub && curl -fL -o samples/goodman-2023/hub/gauged_watersheds.geojson 'https://services1.arcgis.com/CD5mKowwN6nIaqd8/arcgis/rest/services/HJ_Andrews_Hydrology__2018_/FeatureServer/5/query?where=1%3D1&outFields=*&outSR=4326&f=geojson'
mkdir -p samples/goodman-2023/hub && curl -fL -o samples/goodman-2023/hub/roads.geojson 'https://services1.arcgis.com/CD5mKowwN6nIaqd8/arcgis/rest/services/HJ_Andrews_Base_GIS_Layers__2018/FeatureServer/6/query?where=1%3D1&outFields=*&outSR=4326&f=geojson'
mkdir -p samples/goodman-2023/hub && curl -fL -o samples/goodman-2023/hub/harvest_sites.geojson 'https://services1.arcgis.com/CD5mKowwN6nIaqd8/arcgis/rest/services/HJ_Andrews_LCLU__2018/FeatureServer/0/query?where=1%3D1&outFields=*&outSR=4326&f=geojson'
mkdir -p samples/goodman-2023/ge01201 && curl -fL -o samples/goodman-2023/ge01201/ge01201.zip https://andrewsforest.oregonstate.edu/sites/default/files/lter/data/studies/spatialdata/ge01201.zip && unzip -o samples/goodman-2023/ge01201/ge01201.zip -d samples/goodman-2023/ge01201/x
mkdir -p samples/dem3dep && curl -fL -o samples/dem3dep/lookout_creek_26910_8m.tif 'https://elevation.nationalmap.gov/arcgis/rest/services/3DEPElevation/ImageServer/exportImage?bbox=558400,4891600,572400,4904600&bboxSR=26910&imageSR=26910&size=1750,1625&format=tiff&pixelType=F32&noData=-9999&interpolation=RSP_BilinearInterpolation&compression=None&f=image'
mkdir -p samples/hja-open/hf01301 && curl -fL -o samples/hja-open/hf01301/hf01301.zip https://andrewsforest.oregonstate.edu/sites/default/files/lter/data/studies/spatialdata/hf01301.zip && unzip -o samples/hja-open/hf01301/hf01301.zip -d samples/hja-open/hf01301/x
mkdir -p samples/hja-open/dh00101 && curl -fL -o samples/hja-open/dh00101/dh00101.zip https://andrewsforest.oregonstate.edu/sites/default/files/lter/data/studies/spatialdata/dh00101.zip && unzip -o samples/hja-open/dh00101/dh00101.zip -d samples/hja-open/dh00101/x
- Download run.json (112,893 bytes, sha256
05f7f0a658a13beeb112c79e17fb1ec77cf3528481321d084ec614a6fa7eb06e). - Ask your assistant to replay it with NativeGIS, or call the tool directly:
gis_replay {"action": "replay",
            "file": "<absolute path to the run.json you downloaded>",
            "inputRoot": "<your data folder>",
            "outputRoot": "<a new, empty folder>"}
Paths in the run file are relative to the data folder (inputRoot), and outputs go under outputRoot, so nothing depends on where the original run lived.
Files
- run.json: the recorded run: every call, its arguments and the numbers it returned
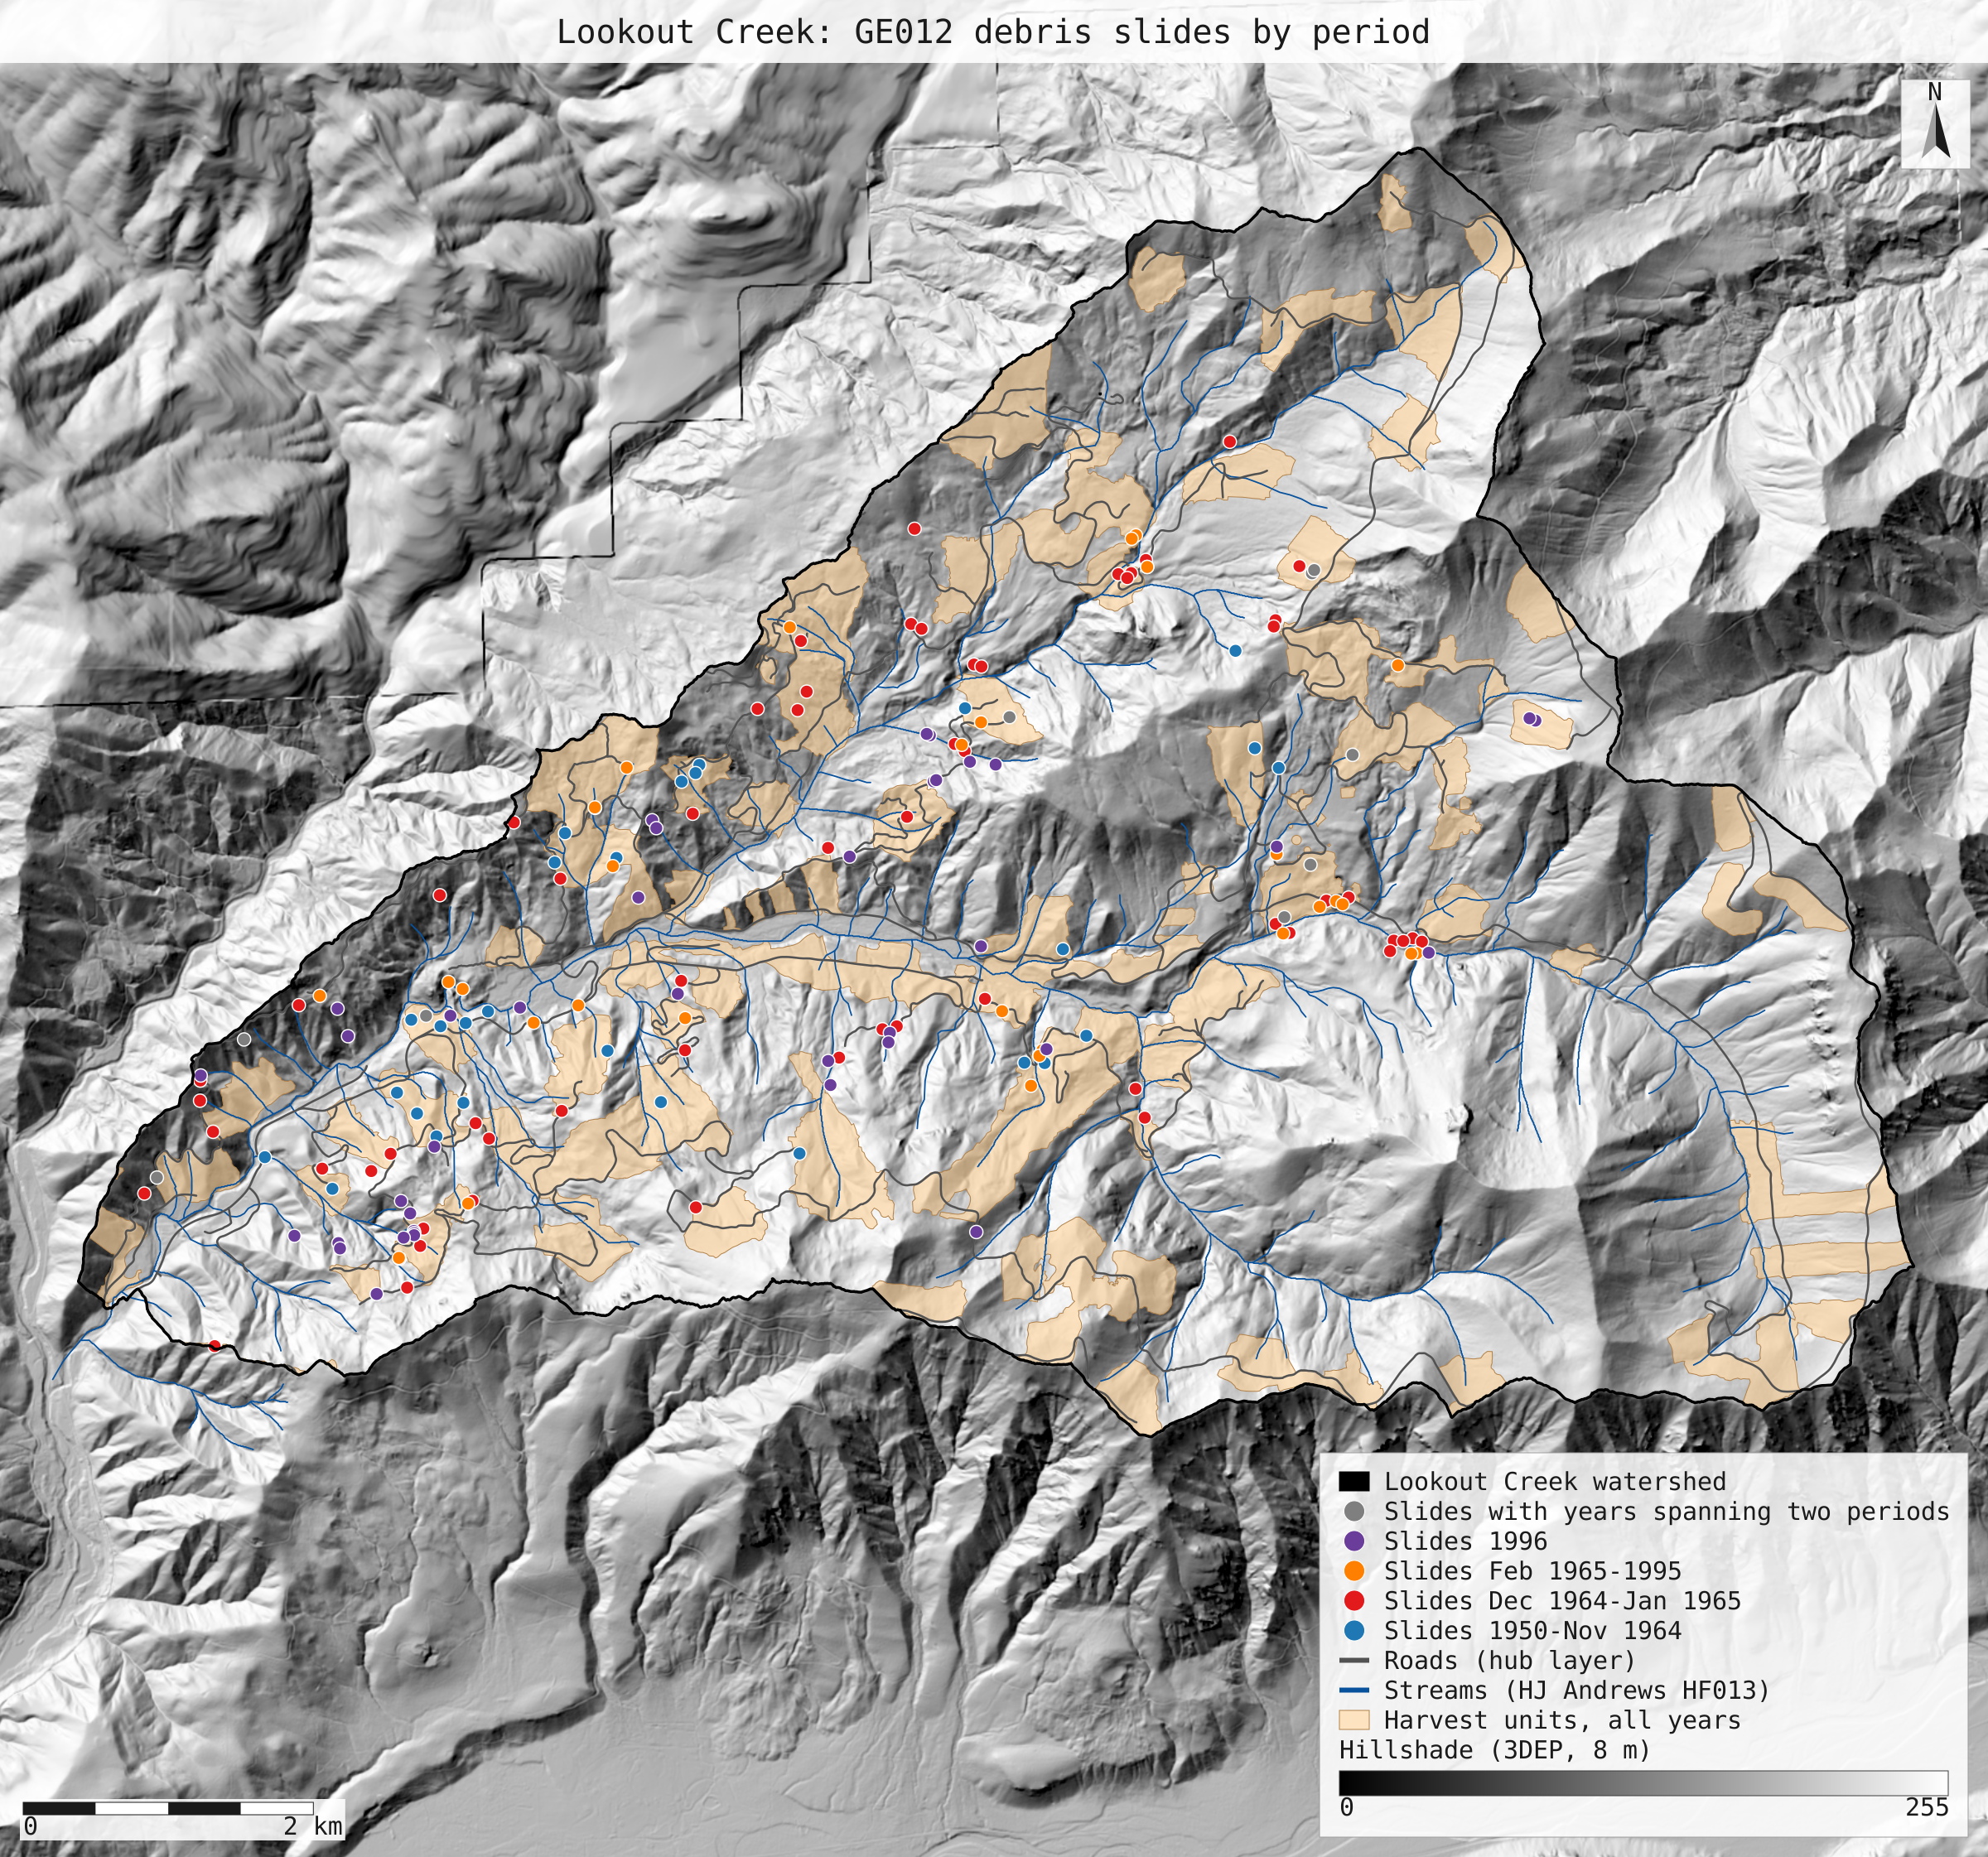
- lookout_slides_by_period.svg: map: the GE012 debris slides in the watershed coloured by period, over the harvest units, roads, streams and an 8 m 3DEP hillshade
Limits
- The hub layers are a live web service. This page used them as downloaded on 2026-10-30; a later download may differ, and replay will refuse it by checksum.
- The hub road layer has no construction dates, so the right of way "by November 1964" cannot be derived from open data. Road length by period comes from DH001 instead, a separately digitised network that runs to 1989; Table 2's 1995 lengths cannot be checked beyond that year.
- The harvest layer stores years, not dates, so the paper's November 1964 cut-off is approximated by the calendar year 1964. Ten units (0.8% of the basin) have no cut year.
- The paper's 2014 landslide inventory and its debris-slide volumes per period are not reproduced. Volumes are text in the GE012 table, and NativeGIS has no way to convert a text field to a number or to sum a field, so no volume total is computed.
- GE012 YEAR values were assigned to periods by hand-written lists (in the recording script), because the field mixes "1964", "64-65", "12/57" and "-55". Other readings of the ranges would shift a few slides between periods.
- Areas are in UTM zone 10N, not an equal-area projection; at Lookout Creek the UTM scale error is under 0.1%, far below the differences discussed here.