How much of the Andrews Forest burned in 2023?
HJ Andrews says the Lookout Fire burned about 70% of the forest. That matches the area the fire covered: 68% of the forest lies inside the incident's final perimeter and inside the BAER soil burn severity map, the two footprints that existed when the figure was first given, and 67% inside the later MTBS perimeter. The ground that actually burned is less: 57% at low, moderate or high severity, about a fifth at high severity.
- Inside the NIFC final incident perimeter (the footprint on 6 Oct 2023)70% → 68.2% −1.8 ptswithin tolerance
- Inside the BAER soil burn severity map (final 3 Oct 2023)70% → 68.1% −1.9 ptswithin tolerance
- Inside the MTBS fire perimeter (mapped later, 2024)70% → 67.4% −2.6 ptsexplained why
- Contrast: actually burned (MTBS low to high severity)70% → 57.0% −13.0 ptswording why
[17, 30, 5]
[13]
[13]
Numbers in brackets, like [14], are step numbers in this study's run.json: the NativeGIS call that returned the figure. NativeGIS 0.3.0, recorded 2026-10-31 15:18 UTC.
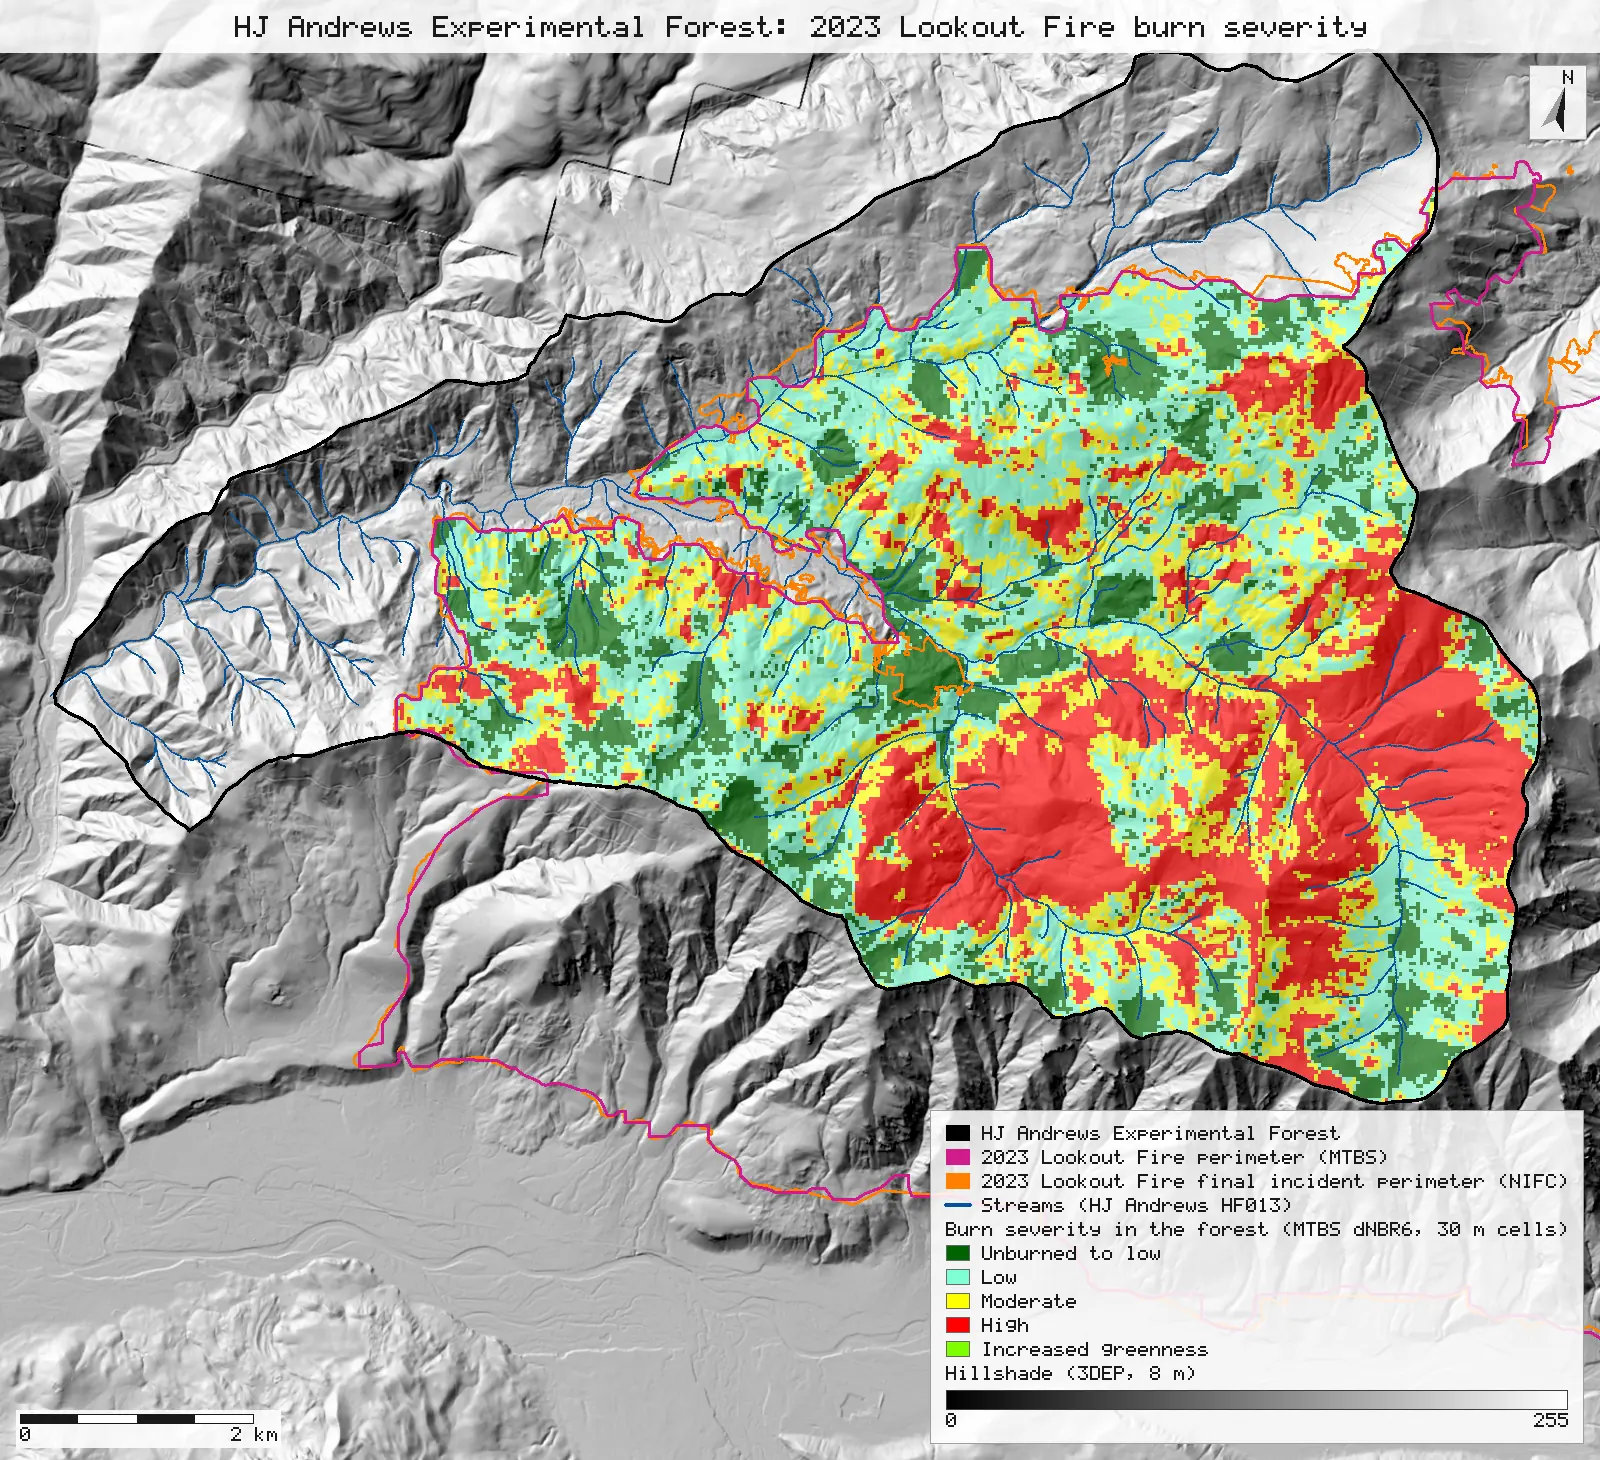
Click or tap a map to open it full screen, then zoom and pan.
What was published
A share of the forest burned: "approximately 70%", first given on 6 October 2023, before MTBS mapped the fire (its post-fire image is from 26 August 2024). The statement does not say how "burned" was measured. So this page measures the area the fire covered with each footprint that existed then, the incident's final perimeter (NIFC) and the BAER soil burn severity map, and with the later MTBS perimeter; and, as a contrast, the share that actually burned (MTBS low, moderate or high severity).
HJ Andrews monthly meeting notice, 6 Oct 2023 · HJ Andrews post-fire field trips page · HJ Andrews Lookout Fire updates, 2023 · MTBS program
Published method. HJ Andrews gives no method, boundary or source for its 70%. During the fire, on 28 and 29 August 2023, its updates page gave 57% of the forest's 6,400 ha as burned to date; the fire kept spreading after that.
The data and where it came from
All of it is open: downloaded without an account or a form.
| Data | Where | Licence |
|---|---|---|
| HJ Andrews Experimental Forest boundary (GI006, boundary83.shp), NAD83 UTM zone 10N | HJ Andrews LTER, 175 kB zip, no form or account https://andrewsforest.oregonstate.edu/sites/default/files/lter/data/studies/spatialdata/gi00601.zip | HJ Andrews data policy (CC BY, acknowledgement requested) |
| MTBS fire bundle for the Lookout Fire (perimeter and dNBR6 severity classes, 30 m, USA Contiguous Albers) | Re-hosted by the HJ Andrews LTER, 8.3 MB zip, no form or account https://andrewsforest.oregonstate.edu/sites/default/files/lter/fsdbdata/gis/LF_or4422212214620230806.zip | US federal data, public domain |
| NIFC WFIGS interagency fire perimeter for the Lookout Fire (incident 2023-ORWIF-230327): the incident's final perimeter, polygon dated 23 Sep 2023, 25,754 ac; GeoJSON in EPSG:5070 from the feature service | National Interagency Fire Center, WFIGS Interagency Perimeters feature service (query, f=geojson), 0.3 MB, no form or account https://services3.arcgis.com/T4QMspbfLg3qTGWY/arcgis/rest/services/WFIGS_Interagency_Perimeters/FeatureServer/0 | US federal data, public domain |
| BAER soil burn severity for the Lookout Fire (item lookout_or4422212214620230806_sbs, final map completed 3 Oct 2023; classes 1 unburned or very low, 2 low, 3 moderate, 4 high; 15 = not mapped), 20 m cells, NAD83 UTM zone 10N | USFS Enterprise Data Warehouse BAER soil burn severity image service, exported on the item's own 20 m grid and extent with no no-data value, uncompressed GeoTIFF, 2.6 MB, no form or account https://imagery.geoplatform.gov/iipp/rest/services/Fire_Aviation/USFS_EDW_BAER_SoilBurnSeverityClassification/ImageServer | US federal data, public domain |
| USGS 3DEP elevation, exported as a 8 m DEM (32-bit float GeoTIFF, EPSG:5070) for the forest's window; used only for the map's hillshade | USGS National Map 3DEP elevation image service (exportImage), no form or account; two exports gave the same sha256 https://elevation.nationalmap.gov/arcgis/rest/services/3DEPElevation/ImageServer | US federal data, public domain |
| HJ Andrews stream network (HF013, hydro.shp), NAD83 UTM zone 10N; drawn on the map only | HJ Andrews LTER, zip, no form or account https://andrewsforest.oregonstate.edu/sites/default/files/lter/data/studies/spatialdata/hf01301.zip | HJ Andrews data policy (CC BY, acknowledgement requested) |
The input files the run read, pinned by checksum
| File (relative to the data folder) | Bytes | sha256 |
|---|---|---|
samples/hja-open/gi00601/x/boundary83.shp | 10,540 | 0774de0a9ebd9693… |
samples/lookout/x/or4422212214620230806_20230731_20240826_burn_bndy.shp | 33,644 | 44058cc0c370ce97… |
samples/lookout/x/or4422212214620230806_20230731_20240826_dnbr6.tif | 398,684 | 221e116ff1ab8180… |
samples/nifc/lookout_2023_wfigs.geojson | 317,021 | d26019924a2a9856… |
samples/baer/lookout_sbs_export_raw.tif | 2,558,000 | 0f0f997a5e3ae9df… |
samples/dem3dep/hja_forest_5070_8m.tif | 12,847,836 | cebeb84b418543df… |
samples/hja-open/hf01301/x/hydro.shp | 173,308 | 263271acd998f7bd… |
Full checksums are in run.json. Replay refuses an input whose checksum differs.
Method
- Open the forest boundary (UTM zone 10N), plus the MTBS perimeter and severity raster (USA Contiguous Albers). As in R1, EPSG:5070 is declared for the perimeter.
- Reproject the boundary to EPSG:5070. Albers is an equal-area projection, so areas measured in it are true areas.
- Intersect the boundary with the MTBS fire perimeter: the part of the forest inside the fire.
- Clip the MTBS severity classes to that intersection (cells whose centre is inside), polygonize them, dissolve by class and measure the areas.
- Open the NIFC final incident perimeter (served in EPSG:5070) and intersect it with the boundary the same way.
- Open the BAER soil burn severity raster (EPSG:26910, 20 m). Count its values, then make one 0/1 raster for "mapped" (classes 1 to 4) and one per class. Their means over the cells whose centre is inside the boundary, in its own UTM projection, are the shares of the forest. Nothing is resampled.
- Render the map as SVG: the MTBS severity classes as 30 m cells at 65% opacity over a hillshade of an 8 m USGS 3DEP DEM, with both fire perimeters, the forest boundary and its streams.
The run made 38 NativeGIS calls: gis_open × 7, gis_process × 25, gis_query × 4, gis_render × 2.
Published numbers next to ours
The claim against three footprints of the fire
| Measure | Area (ha) | Share of the forest |
|---|---|---|
| HJ Andrews, 6 Oct 2023: "burned approximately 70%" | ≈ 70% | |
| The forest (equal-area Albers) [4] | 6,374 | 100% |
| Inside the NIFC final incident perimeter (polygon of 23 Sep 2023) [16, 17] | 4,348 | 68.2% |
| Inside the BAER soil burn severity map's mapped area (final, 3 Oct 2023) [21, 30] | 4,339 | 68.1% |
| Inside the MTBS fire perimeter (post-fire image 26 Aug 2024) [5] | 4,294 | 67.4% |
| Contrast, a different measure: actually burned, MTBS low, moderate or high severity [13] | 3,636 | 57.0% |
| Contrast: BAER soil burn severity low, moderate or high [30] | 3,986 | 62.6% |
| Burned at high severity (MTBS) [13] | 1,223 | 19.2% |
Method: the forest boundary reprojected to EPSG:5070 (Albers equal-area) and intersected with the MTBS perimeter and with the NIFC WFIGS perimeter (25,754 ac in its own attribute) [4, 5, 17]. BAER: 20 m cells of the soil burn severity raster whose centre is inside the boundary, in the raster's own EPSG:26910, counted with one 0/1 raster per class [21, 30]; hectares are the share times the boundary's own area. MTBS severity from dNBR6 cells whose centre falls inside the forest-and-perimeter intersection, polygonized, dissolved by class and measured [6, 8, 9, 11, 13]. Units: m² shown as hectares. n = 159,233 BAER cells (400 m²) and 47,725 MTBS cells (900 m²). The boundary file's own area attribute (UTM) is 6,369 ha [14].
BAER soil burn severity inside the forest
| BAER class | Cells | Share of the forest |
|---|---|---|
| Unburned or very low | 8,842 | 5.6% |
| Low | 82,457 | 51.8% |
| Moderate | 14,261 | 9.0% |
| High | 2,921 | 1.8% |
| Not mapped (value 15) | 50,752 | 31.9% |
| Cells with their centre inside the forest | 159,233 | 100% |
The export holds 270,329 mapped cells and 2,167,251 cells of value 15 (not mapped), and no other value [19]. BAER counts "unburned or very low" inside its mapped area, so even its mapped footprint is not all burned ground.
MTBS severity inside the forest
| MTBS class | ha | Cells | Share of the forest |
|---|---|---|---|
| Unburned to low | 659 | 7,321 | 10.3% |
| Low | 1,434 | 15,931 | 22.5% |
| Moderate | 980 | 10,886 | 15.4% |
| High | 1,223 | 13,585 | 19.2% |
| Increased greenness | 0 | 2 | 0.0% |
Why any numbers differ
- "Approximately 70%" matches the area the fire covered. On 6 October 2023, when HJ Andrews first gave the figure, two footprints of the fire existed: the incident's final perimeter (NIFC, polygon of 23 September) and the BAER soil burn severity map (final on 3 October). 68.2% of the forest lies inside the first, and BAER mapped 68.1% of it. Both lie within 2.5 points of the published 70%, the tolerance these studies use for every "about" figure. The MTBS perimeter, mapped in 2024 from a later image, holds 67.4%, just outside it (2.6 points): a later and slightly tighter outline of the same fire, not a footprint that existed when the figure was given.
- Not everything inside a fire's footprint burned. MTBS classes part of the forest inside its perimeter as unburned to low: unburned islands, and patches the satellite could barely tell from unburned. Counting only MTBS low, moderate and high severity, 57.0% of the forest burned. That is a different quantity from the published figure, shown as a contrast, not as a reading of it. BAER also counts "unburned or very low" (5.6% of the forest) inside its mapped area; its low to high classes cover 62.6%.
- An earlier 57% is a different measure. During the fire, on 28 August 2023, HJ Andrews gave 57% of its 6,400 ha as burned to date: a mid-fire perimeter, before the fire reached its final size. It equals the 57.0% actually burned here only by coincidence.
- High severity: about a fifth by MTBS, far less by BAER. 19% of the whole forest burned at high vegetation severity by MTBS, which is 28% of the part inside its perimeter: the red on the map, in the south-east. BAER rates high soil burn severity on only 1.8% of the forest. The two maps rate different things (vegetation against soil) from images taken almost a year apart.
Replay it yourself
The run file records every call, its arguments, the checksums of the files it read and the numbers it returned. Replaying it repeats every call in a fresh NativeGIS session and checks that each answer comes out the same.
- Make an empty data folder and fetch the inputs into it exactly as below (bash; the folder layout is the one the run file expects):
cd /path/to/an/empty/folder
mkdir -p samples/hja-open/gi00601 && curl -fL -o samples/hja-open/gi00601/gi00601.zip https://andrewsforest.oregonstate.edu/sites/default/files/lter/data/studies/spatialdata/gi00601.zip && unzip -o samples/hja-open/gi00601/gi00601.zip -d samples/hja-open/gi00601/x
mkdir -p samples/lookout && curl -fL -o samples/lookout/LF_or4422212214620230806.zip https://andrewsforest.oregonstate.edu/sites/default/files/lter/fsdbdata/gis/LF_or4422212214620230806.zip && unzip -o samples/lookout/LF_or4422212214620230806.zip -d samples/lookout/x
mkdir -p samples/dem3dep && curl -fL -o samples/dem3dep/hja_forest_5070_8m.tif 'https://elevation.nationalmap.gov/arcgis/rest/services/3DEPElevation/ImageServer/exportImage?bbox=-2066500,2636500,-2052500,2650600&bboxSR=5070&imageSR=5070&size=1750,1763&format=tiff&pixelType=F32&noData=-9999&interpolation=RSP_BilinearInterpolation&compression=None&f=image'
mkdir -p samples/hja-open/hf01301 && curl -fL -o samples/hja-open/hf01301/hf01301.zip https://andrewsforest.oregonstate.edu/sites/default/files/lter/data/studies/spatialdata/hf01301.zip && unzip -o samples/hja-open/hf01301/hf01301.zip -d samples/hja-open/hf01301/x
mkdir -p samples/nifc && curl -fL -o samples/nifc/lookout_2023_wfigs.geojson 'https://services3.arcgis.com/T4QMspbfLg3qTGWY/arcgis/rest/services/WFIGS_Interagency_Perimeters/FeatureServer/0/query?where=attr_UniqueFireIdentifier%3D%272023-ORWIF-230327%27&outFields=OBJECTID,poly_IncidentName,attr_UniqueFireIdentifier,poly_GISAcres,poly_PolygonDateTime&outSR=5070&f=geojson'
mkdir -p samples/baer && curl -fL -o samples/baer/lookout_sbs_export_raw.tif 'https://imagery.geoplatform.gov/iipp/rest/services/Fire_Aviation/USFS_EDW_BAER_SoilBurnSeverityClassification/ImageServer/exportImage?bbox=555218.49909751082,4877231.7363584125,585918.49909751082,4908991.7363584125&bboxSR=26910&imageSR=26910&size=1535,1588&format=tiff&compression=None&pixelType=U8&interpolation=RSP_NearestNeighbor&mosaicRule=%7B%22mosaicMethod%22%3A%22esriMosaicLockRaster%22%2C%22lockRasterIds%22%3A%5B3639%5D%7D&f=image'
- Download run.json (77,068 bytes, sha256
8252843251b03ee865be83ab515ed7371c38c4c0dbaf655d631647c183e4300d). - Ask your assistant to replay it with NativeGIS, or call the tool directly:
gis_replay {"action": "replay",
            "file": "<absolute path to the run.json you downloaded>",
            "inputRoot": "<your data folder>",
            "outputRoot": "<a new, empty folder>"}
Paths in the run file are relative to the data folder (inputRoot), and outputs go under outputRoot, so nothing depends on where the original run lived.
Files
- run.json: the recorded run: every call, its arguments and the numbers it returned
Limits
- HJ Andrews does not say how its 70% was measured, which boundary it used, or which footprint. Three footprints give 67.4% to 68.2%, so the reading holds whichever was used. The comparison is with a round figure, judged with a 2.5-point tolerance.
- The NIFC perimeter is the current version of the polygon in a live service. If it is edited, the download and the shares here would change, and the replay check would show it.
- MTBS severity is a satellite index (dNBR) with thresholds set by an analyst. BAER soil burn severity was checked in the field by a BAER team, mostly from roads.
- BAER leaves 31.9% of the forest unclassified (value 15). BAER cells are counted when their centre is inside the boundary, on the raster's own UTM grid.
- The boundary file is the GI006 polygon. The forest's area differs slightly with the projection: 6,369 ha in the file's own attribute (UTM), 6,374 ha measured in equal-area Albers.