HJ Andrews gauged watersheds: areas and elevations, delineated from a terrain model
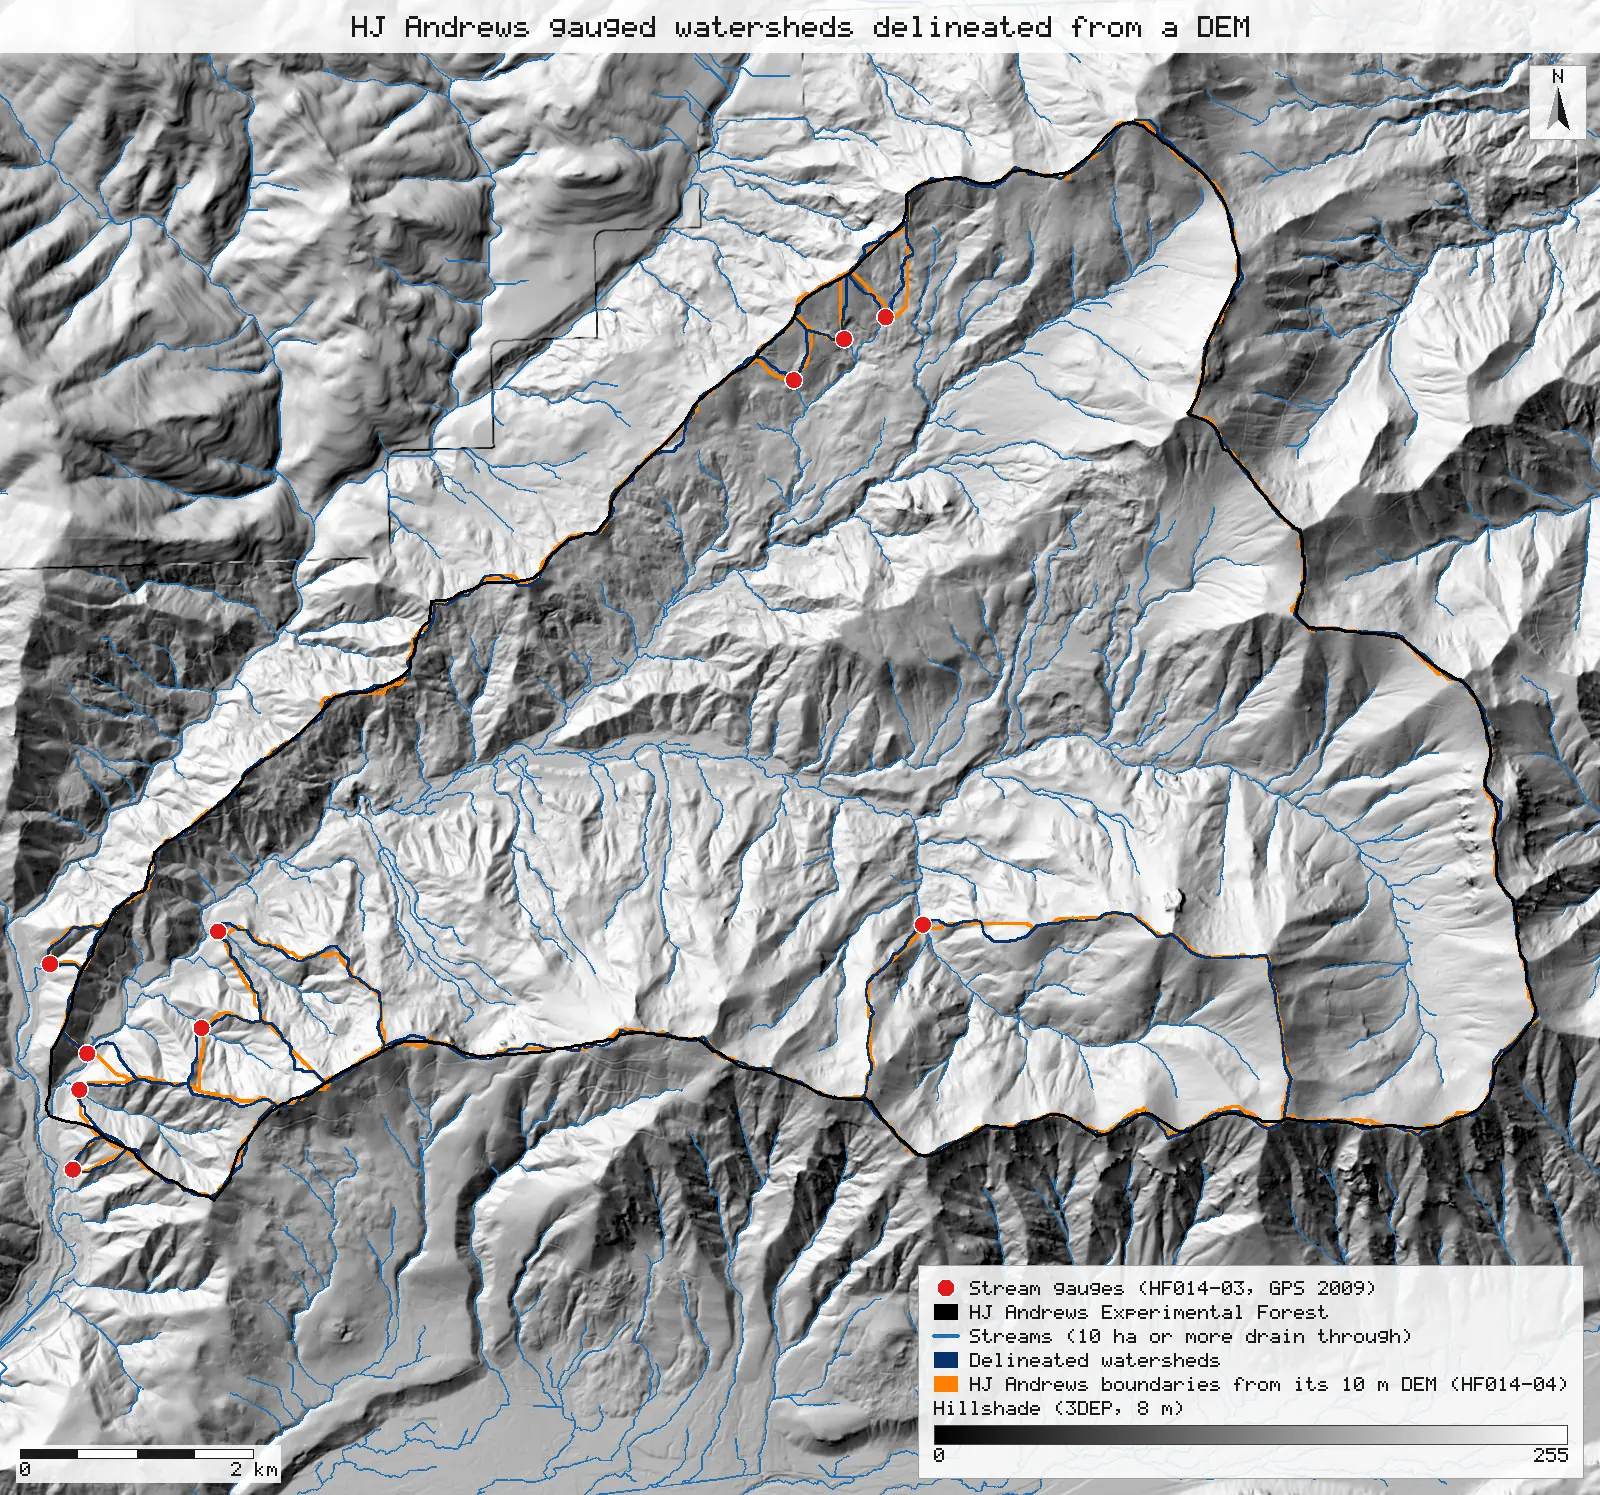
Ten gauged watersheds traced from a public terrain model and the gauges' GPS positions come back at the published areas to within 4% (Lookout Creek 6,240 ha against 6,242), and at the published gauge elevations to within 4 m.
- WS196 ha → 96.1 ha +0.1 ha (+0.073%)match
- WS260 ha → 60.4 ha +0.4 ha (+0.6%)match
- WS3101 ha → 97.8 ha −3.2 ha (−3.2%)within tolerance
- WS613 ha → 12.8 ha −0.2 ha (−1.5%)match
- WS715.4 ha → 15.24 ha −0.2 ha (−1.0%)within tolerance
- WS821.4 ha → 22.20 ha +0.8 ha (+3.7%)within tolerance
- WS98.5 ha → 8.51 ha 0match
- WS1010.2 ha → 10.00 ha −0.2 ha (−1.9%)within tolerance
- Mack Creek580 ha → 575.1 ha −4.9 ha (−0.8%)within tolerance
- Lookout Creek6,242 ha → 6,240.1 ha −1.9 ha (−0.030%)within tolerance
- WS1 gauge439 m → 439.1 m +0.1 m (+0.024%)match
- WS2 gauge545 m → 545.1 m +0.1 m (+0.011%)match
- WS3 gauge476 m → 472.3 m −3.7 m (−0.8%)within tolerance
- WS6 gauge878 m → 877.9 m −0.1 m (−0.009%)match
- WS7 gauge918 m → 917.5 m −0.5 m (−0.054%)match
- WS8 gauge962 m → 961.0 m −1.0 m (−0.1%)within tolerance
- WS9 gauge426 m → 424.6 m −1.4 m (−0.3%)within tolerance
- WS10 gauge461 m → 459.8 m −1.2 m (−0.3%)within tolerance
- Mack Creek gauge755 m → 754.9 m −0.1 m (−0.014%)match
- Lookout Creek gauge422 m → 421.6 m −0.4 m (−0.1%)match
[8, 9]
[9]
[18]
Numbers in brackets, like [14], are step numbers in this study's run.json: the NativeGIS call that returned the figure. NativeGIS 0.3.0, recorded 2026-10-31 07:31 UTC.
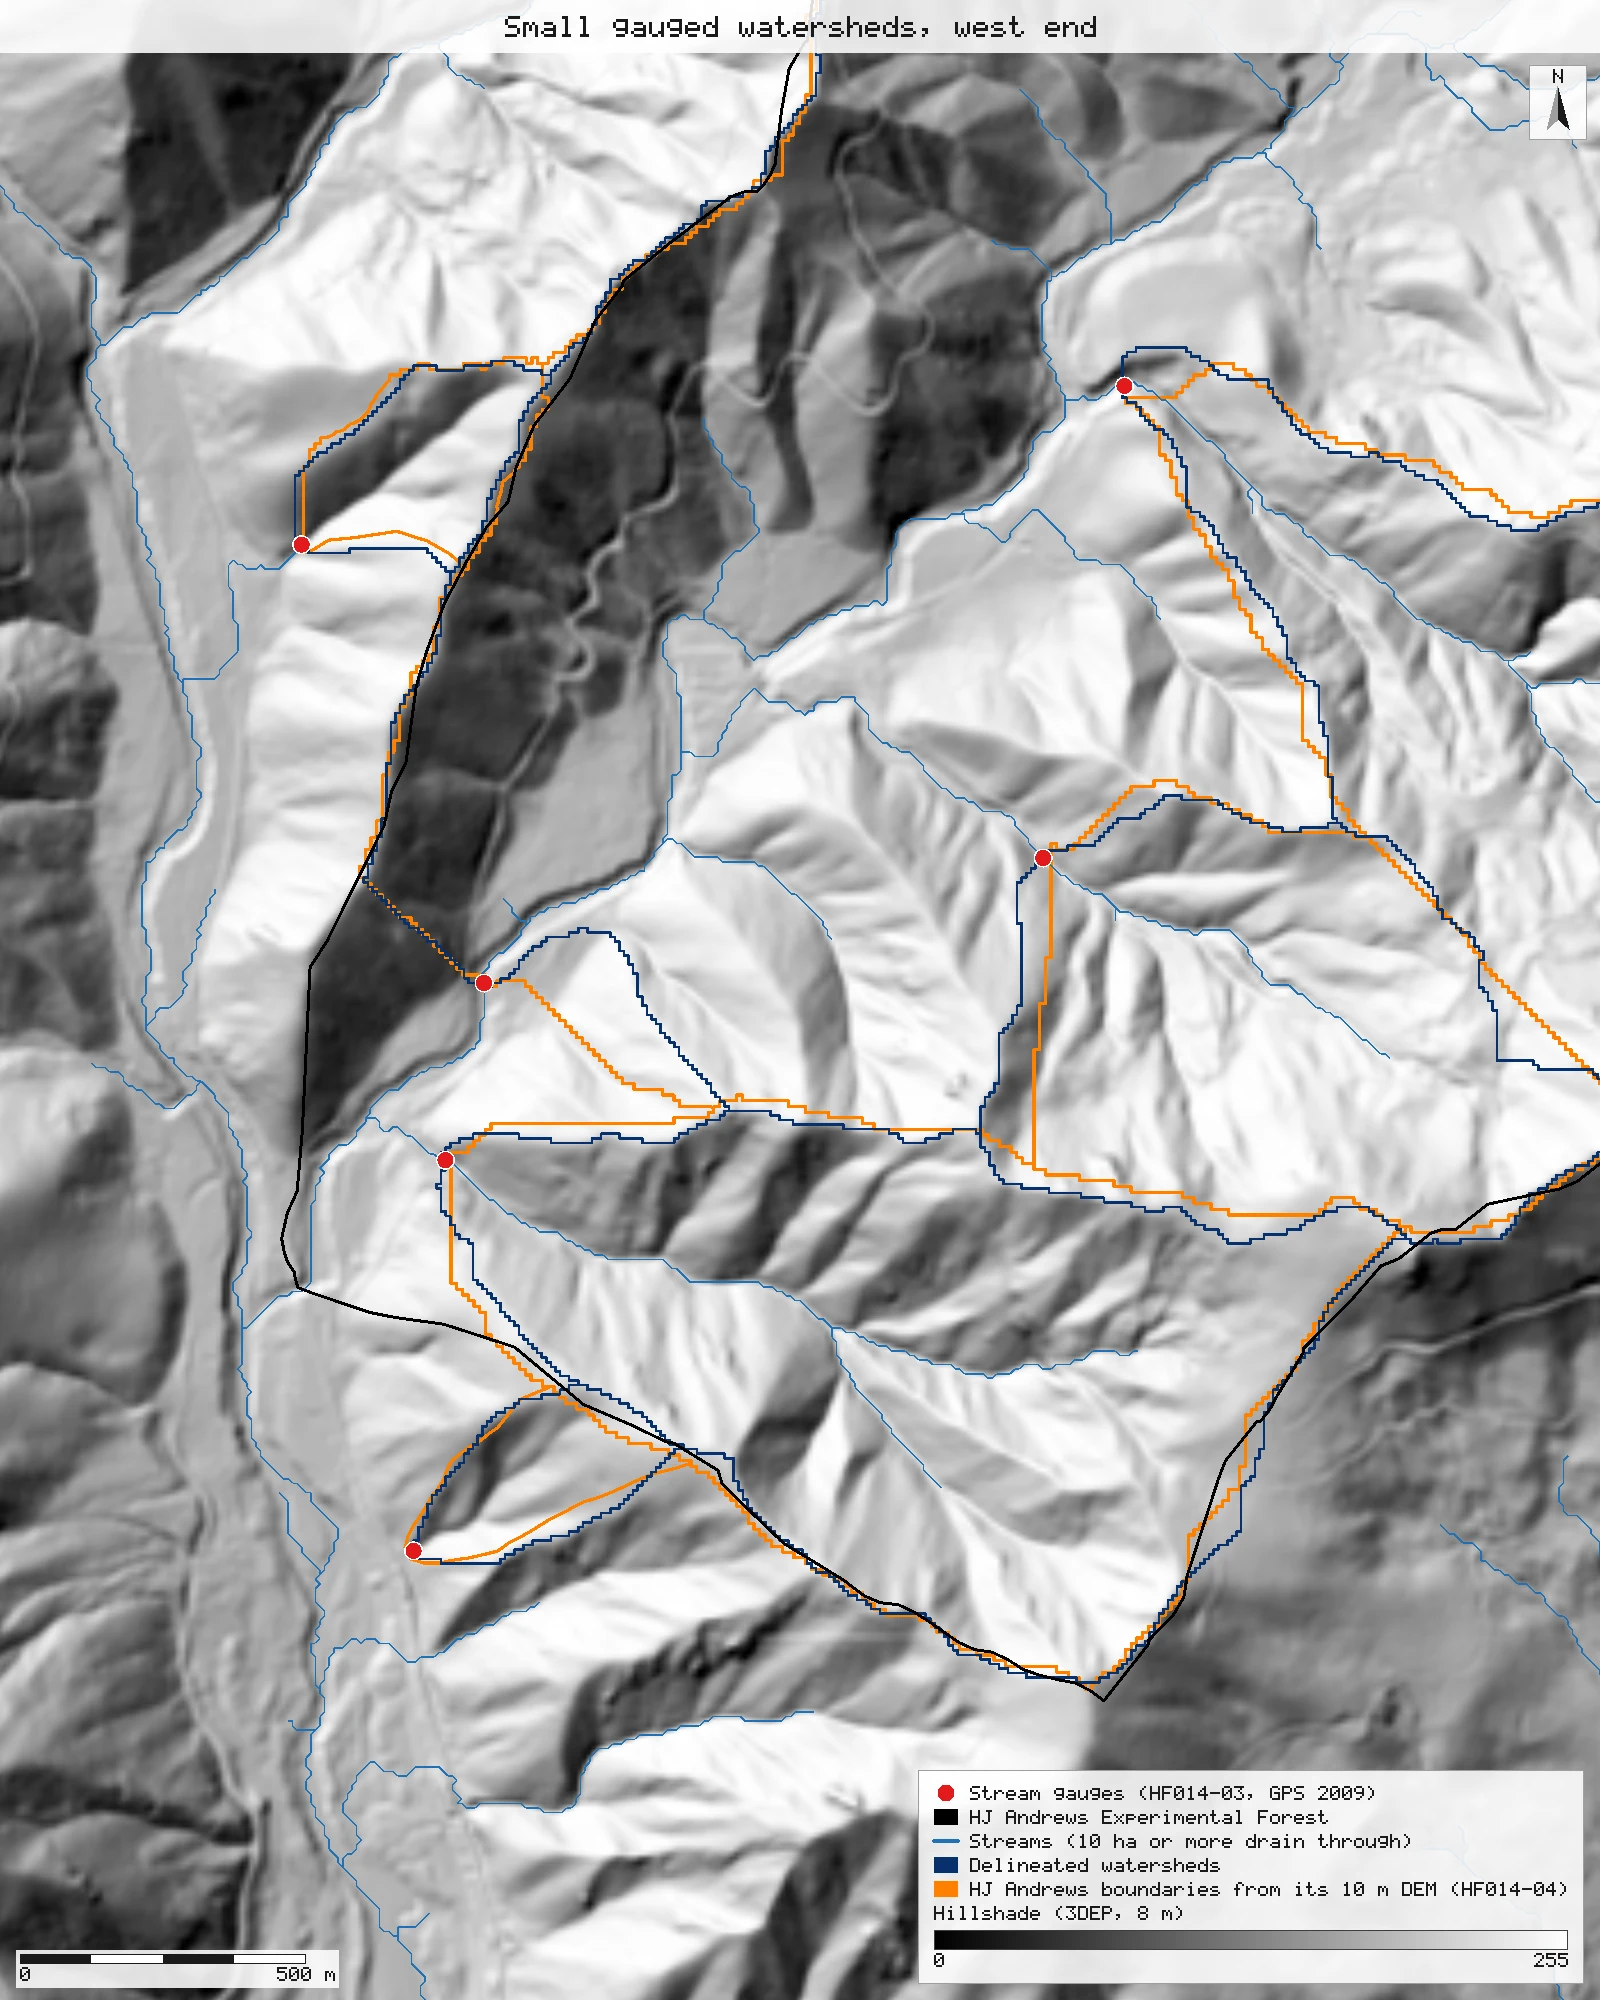
The small watersheds at the west end
WS1, WS2, WS3, WS9 and WS10, at 1.2 m per pixel. The delineated boundaries follow the same ridges as HJ Andrews' layer; where they part, it is by a cell or two on a broad ridge.
Click or tap a map to open it full screen, then zoom and pan.
What was published
The HJ Andrews "Experimental Watersheds" table gives each gauged watershed's area and the elevations of its gauge and its highest point: WS1 96 ha (439–1,027 m), WS2 60 ha (545–1,079 m), WS3 101 ha (476–1,080 m), WS6 13 ha (878–1,029 m), WS7 15.4 ha (918–1,102 m), WS8 21.4 ha (962–1,182 m), WS9 8.5 ha (426–731 m), WS10 10.2 ha (461–679 m), Mack Creek 580 ha (755–1,626 m) and Lookout Creek 6,242 ha (422–1,627 m). The same page's menu, and the forest's fast facts, give Lookout Creek 6,232 ha and Mack Creek 1,436 ha.
Experimental Watersheds (HJ Andrews) · HJ Andrews data catalogue
Published method. The table does not say how the areas were measured. HJ Andrews also publishes two boundary layers: HF014-02, boundaries above the gauges, and HF014-04, boundaries derived from a 10 m DEM.
The data and where it came from
All of it is open: downloaded without an account or a form.
| Data | Where | Licence |
|---|---|---|
| USGS 3DEP elevation, exported as an 8 m DEM (32-bit float GeoTIFF, EPSG:26910) over the Lookout Creek basin | USGS National Map 3DEP elevation image service (exportImage), no form or account https://elevation.nationalmap.gov/arcgis/rest/services/3DEPElevation/ImageServer | US federal data, public domain |
| Stream gauges, GPS survey 2009 (HF014-03, strgage_09.shp), NAD83 UTM zone 10N | HJ Andrews LTER, zip, no form or account https://andrewsforest.oregonstate.edu/sites/default/files/lter/data/studies/spatialdata/hf01403.zip | HJ Andrews data policy (CC BY, acknowledgement requested) |
| Gauged watershed boundaries above the gauges (HF014-02, gagedws.shp) | HJ Andrews LTER, zip, no form or account https://andrewsforest.oregonstate.edu/sites/default/files/lter/data/studies/spatialdata/hf01402.zip | HJ Andrews data policy (CC BY, acknowledgement requested) |
| Gauged watershed boundaries from a 10 m DEM (HF014-04, wsheddem.shp) | HJ Andrews LTER, zip, no form or account https://andrewsforest.oregonstate.edu/sites/default/files/lter/data/studies/spatialdata/hf01404.zip | HJ Andrews data policy (CC BY, acknowledgement requested) |
| HJ Andrews Experimental Forest boundary (GI006, boundary83.shp) | HJ Andrews LTER, zip, no form or account https://andrewsforest.oregonstate.edu/sites/default/files/lter/data/studies/spatialdata/gi00601.zip | HJ Andrews data policy (CC BY, acknowledgement requested) |
The input files the run read, pinned by checksum
| File (relative to the data folder) | Bytes | sha256 |
|---|---|---|
samples/dem3dep/lookout_creek_26910_8m.tif | 11,930,186 | de869b30bf1a2161… |
samples/hja-open/hf01403/x/strgage_09.shp | 460 | 152fd9ab937657c2… |
samples/hja-open/hf01402/x/gagedws.shp | 29,892 | a86790fe3700b79a… |
samples/hja-open/hf01404/x/wsheddem.shp | 149,876 | 6cbafbe316d2fa08… |
samples/hja-open/gi00601/x/boundary83.shp | 10,540 | 0774de0a9ebd9693… |
Full checksums are in run.json. Replay refuses an input whose checksum differs.
Method
- Open the 8 m 3DEP DEM, the ten gauges (HF014-03) and HJ Andrews' two boundary layers (HF014-02, HF014-04).
- D8 flow direction on the DEM (gis_process flowDirection). Depressions drain as if filled: the DEM is flooded inward from its edge (Priority-Flood), and flats drain toward their spill point.
- Watersheds: every cell upstream of each gauge (gis_process watershed). A gauge is moved to the nearest cell within 30 m that drains at least 2 ha, so a gauge a few metres off the D8 channel lands on it and one already on it stays put. The largest move is 6 m.
- Stream links where 10 ha or more drain through, for the maps (gis_process streams).
- Measure HJ Andrews' boundary polygons, the overlap of each delineated watershed with HF014-04 (intersect, measure), and the part of each watershed inside the Experimental Forest.
- Lowest and highest DEM cell in each delineated watershed (zonal min and max), against the published gauge and summit elevations.
- Render the maps: the delineated watersheds (blue), HF014-04 (orange), the streams, the forest boundary and the gauges, over a hillshade of the same DEM.
The run made 30 NativeGIS calls: gis_open × 5, gis_query × 7, gis_process × 14, gis_render × 4.
Published numbers next to ours
Ten gauged watersheds, published and delineated
| Watershed | Published (ha) | Delineated (ha) | Difference | HF014-04 (ha) | Overlap with HF014-04 (IoU) | Gauge: published / lowest cell (m) | Summit: published / highest cell (m) |
|---|---|---|---|---|---|---|---|
| WS1 | 96 | 96.1 | +0.07% | 101.0 | 0.91 | 439 / 439 | 1,027 / 1,014 |
| WS2 | 60 | 60.4 | +0.6% | 56.9 | 0.86 | 545 / 545 | 1,079 / 1,077 |
| WS3 | 101 | 97.8 | −3.2% | 96.9 | 0.91 | 476 / 472 | 1,080 / 1,077 |
| WS6 | 13 | 12.8 | −1.5% | 15.3 | 0.79 | 878 / 878 | 1,029 / 1,023 |
| WS7 | 15.4 | 15.2 | −1.0% | 14.3 | 0.79 | 918 / 918 | 1,102 / 1,104 |
| WS8 | 21.4 | 22.2 | +3.7% | 21.6 | 0.70 | 962 / 961 | 1,182 / 1,193 |
| WS9 | 8.5 | 8.5 | +0.1% | 7.0 | 0.75 | 426 / 425 | 731 / 712 |
| WS10 | 10.2 | 10.0 | −1.9% | 10.3 | 0.83 | 461 / 460 | 679 / 691 |
| Mack Creek | 580 | 575.1 | −0.8% | 575.1 | 0.97 | 755 / 755 | 1,626 / 1,619 |
| Lookout Creek | 6,242 | 6,240.1 | −0.03% | 5,451.9* | – | 422 / 422 | 1,627 / 1,627 |
Delineated areas [8, 9], HF014-04 areas [12, 13], overlaps [15, 16], elevations [17, 18]. IoU is the shared area over the combined area. *HF014-04's Lookout polygon leaves out the six gauged watersheds nested in the basin; with them added back it is 6,232 ha. Units: hectares from 8 m cells (64 m²) in NAD83 / UTM zone 10N; elevations in metres from the 3DEP DEM.
Why any numbers differ
- Areas. Eight of the ten delineated watersheds are within 2% of the published area. WS3 is 3.2% smaller and WS8 3.7% larger; both sit on narrow ridges where an 8 m DEM cell decides which side of the divide a strip falls on. HJ Andrews' own DEM layer (HF014-04) differs from the table by more: WS1 101 ha against 96, WS9 7.0 against 8.5.
- Lookout Creek: two published areas, both explained. The table's 6,242 ha matches the whole basin above the gauge (6,240 ha delineated). The menu's 6,232 ha is the sum of HJ Andrews' HF014-04 polygons for Lookout Creek: its "LOOK" polygon is the basin minus the six gauged watersheds nested inside it (Mack Creek, WS2, WS3, WS6, WS7, WS8), and adding those back gives 6,232 ha. The measured overlaps show it: the delineated Lookout basin holds 99.6% of HF014-04's LOOK polygon, and the nested watersheds lie inside it too.
- Mack Creek's 1,436 ha in the menu is not the watershed above the Mack Creek gauge (580 ha published, 575 ha delineated, 579 ha in HF014-02). We could not tell what area it measures.
- Elevations. The lowest DEM cell of each watershed is within 4 m of the published gauge elevation. The highest is within 19 m of the published maximum; an 8 m DEM averages over summits, which lowers the peaks of the small watersheds most (WS9 712 m against 731).
- HF014-02 leaves the HECTARES attribute at 0 for WS9, WS10 and the four "a" add-on polygons; their geometry measures 7.2 ha (WS9) and 11.4 ha (WS10).
Replay it yourself
The run file records every call, its arguments, the checksums of the files it read and the numbers it returned. Replaying it repeats every call in a fresh NativeGIS session and checks that each answer comes out the same.
- Make an empty data folder and fetch the inputs into it exactly as below (bash; the folder layout is the one the run file expects):
cd /path/to/an/empty/folder
mkdir -p samples/dem3dep && curl -fL -o samples/dem3dep/lookout_creek_26910_8m.tif 'https://elevation.nationalmap.gov/arcgis/rest/services/3DEPElevation/ImageServer/exportImage?bbox=558400,4891600,572400,4904600&bboxSR=26910&imageSR=26910&size=1750,1625&format=tiff&pixelType=F32&noData=-9999&interpolation=RSP_BilinearInterpolation&compression=None&f=image'
mkdir -p samples/hja-open/hf01403 && curl -fL -o samples/hja-open/hf01403/hf01403.zip https://andrewsforest.oregonstate.edu/sites/default/files/lter/data/studies/spatialdata/hf01403.zip && unzip -o samples/hja-open/hf01403/hf01403.zip -d samples/hja-open/hf01403/x
mkdir -p samples/hja-open/hf01402 && curl -fL -o samples/hja-open/hf01402/hf01402.zip https://andrewsforest.oregonstate.edu/sites/default/files/lter/data/studies/spatialdata/hf01402.zip && unzip -o samples/hja-open/hf01402/hf01402.zip -d samples/hja-open/hf01402/x
mkdir -p samples/hja-open/hf01404 && curl -fL -o samples/hja-open/hf01404/hf01404.zip https://andrewsforest.oregonstate.edu/sites/default/files/lter/data/studies/spatialdata/hf01404.zip && unzip -o samples/hja-open/hf01404/hf01404.zip -d samples/hja-open/hf01404/x
mkdir -p samples/hja-open/gi00601 && curl -fL -o samples/hja-open/gi00601/gi00601.zip https://andrewsforest.oregonstate.edu/sites/default/files/lter/data/studies/spatialdata/gi00601.zip && unzip -o samples/hja-open/gi00601/gi00601.zip -d samples/hja-open/gi00601/x
- Download run.json (75,682 bytes, sha256
379854d3666de905dd4e4cc04108863cbad5dddd11b885d4b9f30213fc859efa). - Ask your assistant to replay it with NativeGIS, or call the tool directly:
gis_replay {"action": "replay",
            "file": "<absolute path to the run.json you downloaded>",
            "inputRoot": "<your data folder>",
            "outputRoot": "<a new, empty folder>"}
Paths in the run file are relative to the data folder (inputRoot), and outputs go under outputRoot, so nothing depends on where the original run lived.
Files
- run.json: the recorded run: every call, its arguments and the numbers it returned
Limits
- The DEM is a public 8 m export of the 3DEP 1 m LiDAR terrain. A watershed boundary on a broad ridge can move by a cell either way with the DEM's resolution, and HJ Andrews' own table does not say which DEM or method gave its areas.
- Gauge positions are HJ Andrews' 2009 GPS survey (HF014-03). The snapping rule (nearest cell within 30 m draining at least 2 ha) moved no gauge more than 6 m; without it, two gauges sit on hillslope cells beside their channel.
- Watersheds of nested gauges overlap: Mack Creek's cells are inside Lookout Creek's, as they are on the ground.