Rain gauges against an elevation-aware climate surface: how much a plain interpolation misses in the HJ Andrews mountains
Against the PRISM grid for 1971-2000, the 13 long-record HJ Andrews gauges agree to 0.5% on average and a distance-only interpolation of them misses only 9 mm (0.4%) over the forest, though 181 mm (7.1%) above 1,300 m. The first PRISM grid, for 1980-89, puts 9.2% more rain on the forest and rises 1.10 mm per metre of elevation against 0.61: most of the 20% storage-gauge shortfall an earlier version of this page reported came from that grid.
- PRISM 1971-2000 (MS027 ms02727), forest mean2.10 m → 2.30 m +0.2 m (+9.4%)explained why
- PRISM 1991-2020 normals, 800 m, forest mean2.10 m → 2.31 m +0.2 m (+10.1%)explained why
- IDW of the 13 long-record gauges, 1971-2000, forest mean2.10 m → 2.29 m +0.2 m (+9.0%)within tolerance why
- PRISM 1980-89 (ms02714, the first grid, since updated), forest mean2.10 m → 2.51 m +0.4 m (+19.5%)explained why
- PRIMET gauge, water years 1980-892,302 mm → 2,235 mm −67.3 mm (−2.9%)within tolerance
- PRIMET gauge, its 21 complete water years of 1971-20002,302 mm → 2,247 mm −54.5 mm (−2.4%)within tolerance
[93]
[82]
[153, 156, 159, 162, 165, 168]
Numbers in brackets, like [14], are step numbers in this study's run.json: the NativeGIS call that returned the figure. NativeGIS 0.3.0, recorded 2026-10-31 15:23 UTC.
Click or tap a map to open it full screen, then zoom and pan.
What was published
The problem: rain gauges stand mostly in valleys and on roads, while mountain precipitation rises with elevation, so how much does a simple interpolation of the gauges miss? HJ Andrews publishes both sides. MS027 holds Chris Daly's PRISM grids for the forest: the first, for 1980-89 at 100 m (ms02714), and newer ones for 1971-2000 at 50 m (ms02715 to ms02727; the MS027 page says the grids "were updated for a greater time span" and a larger extent). PRISM fits precipitation to elevation and slope orientation from station data and a DEM. MS004 holds the daily precipitation of every gauge with its coordinates. Two published figures anchor the result: Fast Facts gives the average annual rainfall as "7 feet (2.1 meters)", without a place or period, and the PRIMET climate diagram (Bierlmaier and McKee 1989, figure 2) gives 2,302 mm a year at 426 m for 1972-84.
MS027 PRISM grids (EDI) · PRISM 1991-2020 normals (PRISM Climate Group) · Fast Facts (HJ Andrews) · Bierlmaier and McKee 1989, PNW-GTR-242 (PDF) · HJ Andrews data catalogue
Published method. PRISM (Parameter-elevation Regressions on Independent Slopes Model) is a regression of station precipitation on elevation, fitted locally and weighted by distance, slope orientation and terrain. The MS027 metadata does not list which stations entered either fit, but the HJ Andrews meteorological network is cited as a source, so the gauges here are not independent of PRISM.
The data and where it came from
All of it is open: downloaded without an account or a form.
| Data | Where | Licence |
|---|---|---|
| PRISM mean annual precipitation 1971-2000, 50 m grid in millimetres x 100, ArcInfo E00 (MS027, ms02727.e00), NAD83 / UTM zone 10N | HJ Andrews LTER, zip, no form or account https://andrewsforest.oregonstate.edu/sites/default/files/lter/data/studies/spatialdata/ms02727.zip | HJ Andrews data policy (CC BY, acknowledgement requested) |
| PRISM mean annual precipitation 1980-89, 100 m grid in mm, ArcInfo E00 (MS027, ms02714.e00), NAD83 / UTM zone 10N | HJ Andrews LTER, zip, no form or account https://andrewsforest.oregonstate.edu/sites/default/files/lter/data/studies/spatialdata/ms02714.zip | HJ Andrews data policy (CC BY, acknowledgement requested) |
| PRISM 1991-2020 normals, annual precipitation, 800 m (30 arc-second) Cloud Optimized GeoTIFF in mm, NAD83 geographic | PRISM Climate Group, Oregon State University, plain HTTP download, no form or account https://data.prism.oregonstate.edu/normals/us/800m/ppt/monthly/prism_ppt_us_30s_2020_avg_30y.zip | PRISM terms of use (free with attribution) |
| Rain gauge inventory with coordinates and gauge type (MS00401) | HJ Andrews LTER, static CSV, no form or account https://andrewsforest.oregonstate.edu/sites/default/files/lter/fsdbdata/cache/MS00401_v1.csv | HJ Andrews data policy (CC BY, acknowledgement requested) |
| Daily precipitation, meteorological stations (MS00403) and rain gauge network (MS00404) | HJ Andrews LTER, static CSV, no form or account https://andrewsforest.oregonstate.edu/sites/default/files/lter/fsdbdata/cache/MS00404_v3.csv | HJ Andrews data policy (CC BY, acknowledgement requested) |
| HJ Andrews Experimental Forest boundary (GI006, boundary83.shp) | HJ Andrews LTER, zip, no form or account https://andrewsforest.oregonstate.edu/sites/default/files/lter/data/studies/spatialdata/gi00601.zip | HJ Andrews data policy (CC BY, acknowledgement requested) |
| USGS 3DEP elevation on the 1980-89 PRISM grid's 100 m cells (32-bit float GeoTIFF, EPSG:26910) | USGS National Map 3DEP elevation image service (exportImage), no form or account https://elevation.nationalmap.gov/arcgis/rest/services/3DEPElevation/ImageServer | US federal data, public domain |
The input files the run read, pinned by checksum
| File (relative to the data folder) | Bytes | sha256 |
|---|---|---|
samples/hja-open/ms02727/x/ms02727.e00 | 5,230,399 | 472e35507996077f… |
samples/hja-open/ms02714/x/ms02714.e00 | 457,915 | 70a1a8eb0ed9dc3f… |
samples/prism-normals/x/prism_ppt_us_30s_2020_avg_30y.tif | 64,773,157 | ffd3c9c775ab8525… |
samples/hja-open/gi00601/x/boundary83.shp | 10,540 | 0774de0a9ebd9693… |
samples/dem3dep/hja_prism_grid_26910_100m.tif | 132,266 | 79495ff02b14ea43… |
derived/hja_gauge_water_years_1971_2000.csv | 29,909 | 1be8e26289a97e47… |
samples/hja-open/ms004/MS00401_v1.csv | 14,826 | 116793f9be8e5bea… |
samples/hja-open/ms004/MS00403_v9.csv | 8,150,364 | 5e33768379f3c98f… |
samples/hja-open/ms004/MS00404_v3.csv | 20,082,402 | 6a943c75c7651032… |
Full checksums are in run.json. Replay refuses an input whose checksum differs.
Method
- Water years, outside NativeGIS: node tools/repro/hja-precip-gauge-means.js <data folder> reads the two daily files and writes derived/hja_gauge_water_years_1971_2000.csv, one row per gauge and water year (1 October to 30 September) from 1971 to 2000, with the days that carry a value and their sum (days HJ Andrews flags as estimated count). It is a small deterministic script because NativeGIS expressions have no date functions to turn a date into a water year. The file is a download on this page; run the script after the fetch commands below, before replaying. Everything after this step runs in NativeGIS.
- Completeness rule, the same per year for both periods: a water year counts when at least 90% of its days carry a value. For 1971-2000 a gauge is kept with at least 15 such years (half the period); for 1980-89 with all 10. A gauge's mean is the total over its complete years divided by their days, times their mean length, which is the total divided by the years when no day is missing. In NativeGIS: field calculator for the share of days, a query for the rule, summarize by gauge, and gis_process join onto the gauge points of the MS00401 inventory, which has coordinates. 46 gauges report in 1971-2000 and 13 are kept; 29 report in 1980-89 and 20 (at 19 sites) are kept, every one with all 3,653 days.
- Check on the script: NativeGIS opens both daily files as attribute tables (csv table), keeps each period with a date filter and sums each gauge (summarize); every gauge's day count and sum equal the water-year table's, in both periods.
- Open the PRISM grids (gis_open reads the E00 exports; CRS from their PRJ). ms02727 stores millimetres x 100 and is divided by 100. ms02714's outer frame of 540 cells holds -108, a fill value its header does not declare as nodata, so negative cells are set to nodata, leaving 17,760 cells. The 800 m normals are opened as they are, and the forest boundary is reprojected to their NAD83 geographic coordinates.
- For each period, reproject the kept gauges to NAD83 / UTM zone 10N and interpolate their means by inverse distance weighting (power 2, 12 nearest) onto that period's PRISM cells, with leave-one-out cross-validation (interpolate crossValidate); subtract PRISM.
- Zonal means of each surface and difference over the forest boundary, and over four elevation bands of a 3DEP DEM exported on the 1980-89 grid's cells (reclassify, polygonize, dissolve, intersect with the boundary, zonal).
- Grid against grid: resample the 1971-2000 grid onto the 100 m cells (bilinear) and subtract it from the 1980-89 grid. The rise with elevation is the least-squares slope of precipitation on elevation over the forest's 100 m cells, from zonal means of elevation, precipitation and their centred products.
- At the gauges: sample PRISM, IDW and elevation in the cell holding each gauge; gauge minus PRISM overall and by gauge type (field calculator, summarize); the 1980-89 gauges also against the 1971-2000 grid.
- Render PRISM 1971-2000 and its IDW on one colour scale, and the two differences on diverging ramps centred on zero (gis_render redblue), over a hillshade of the 100 m DEM with the gauges labelled.
The run made 183 NativeGIS calls: gis_open × 9, gis_process × 77, gis_query × 53, gis_close × 36, gis_render × 8.
The numbers
Mean annual precipitation over the forest
| Over the Experimental Forest (cells whose centre is inside) | Cells | Mean (mm/yr) | Lowest cell | Highest cell |
|---|---|---|---|---|
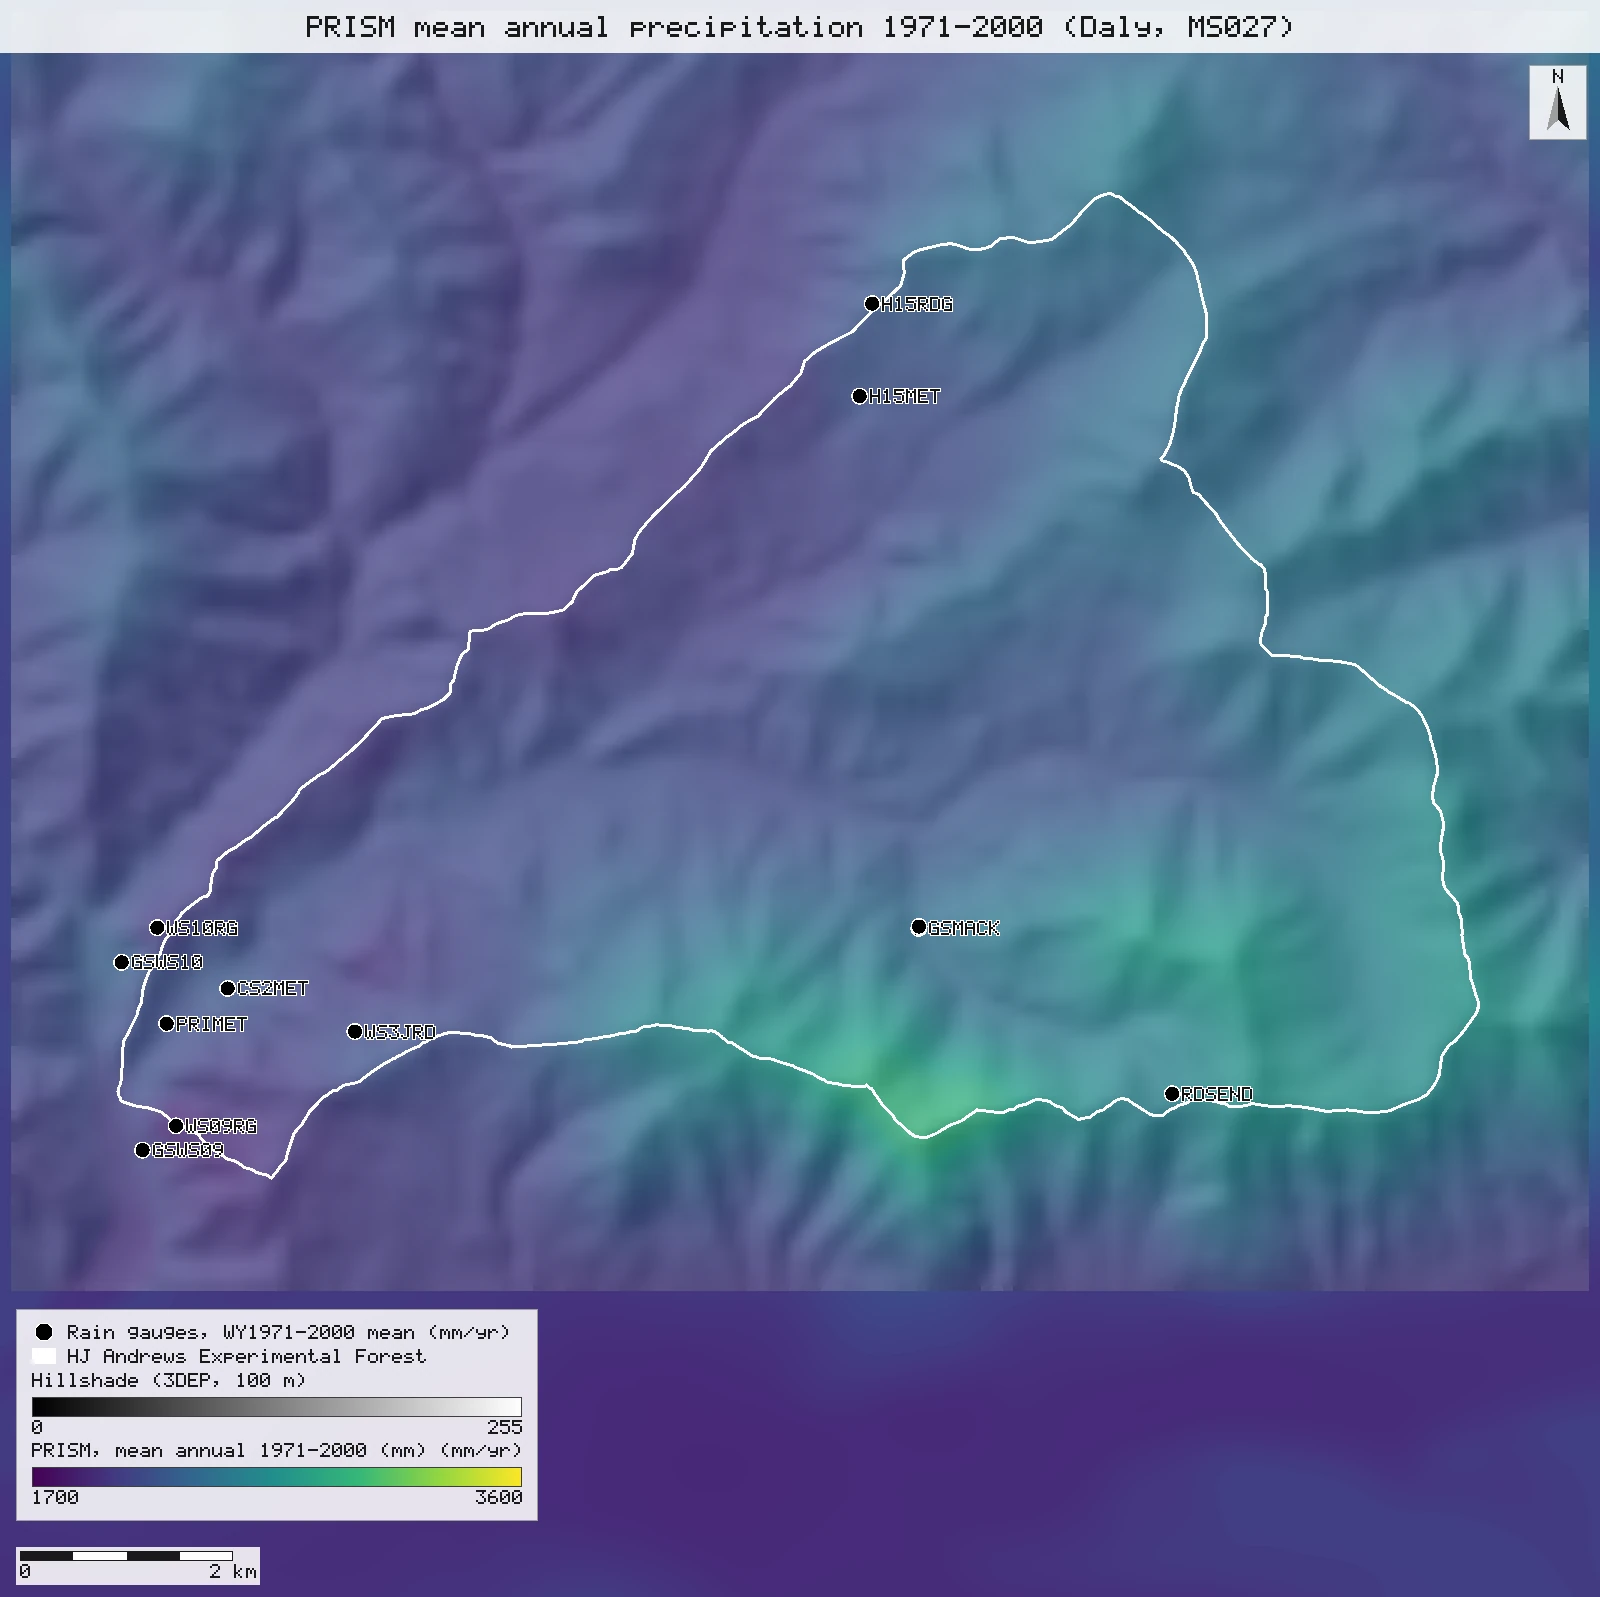
| PRISM 1971–2000 (Daly, MS027 ms02727, 50 m) | 25,479 | 2,297 | 1,897 | 2,944 |
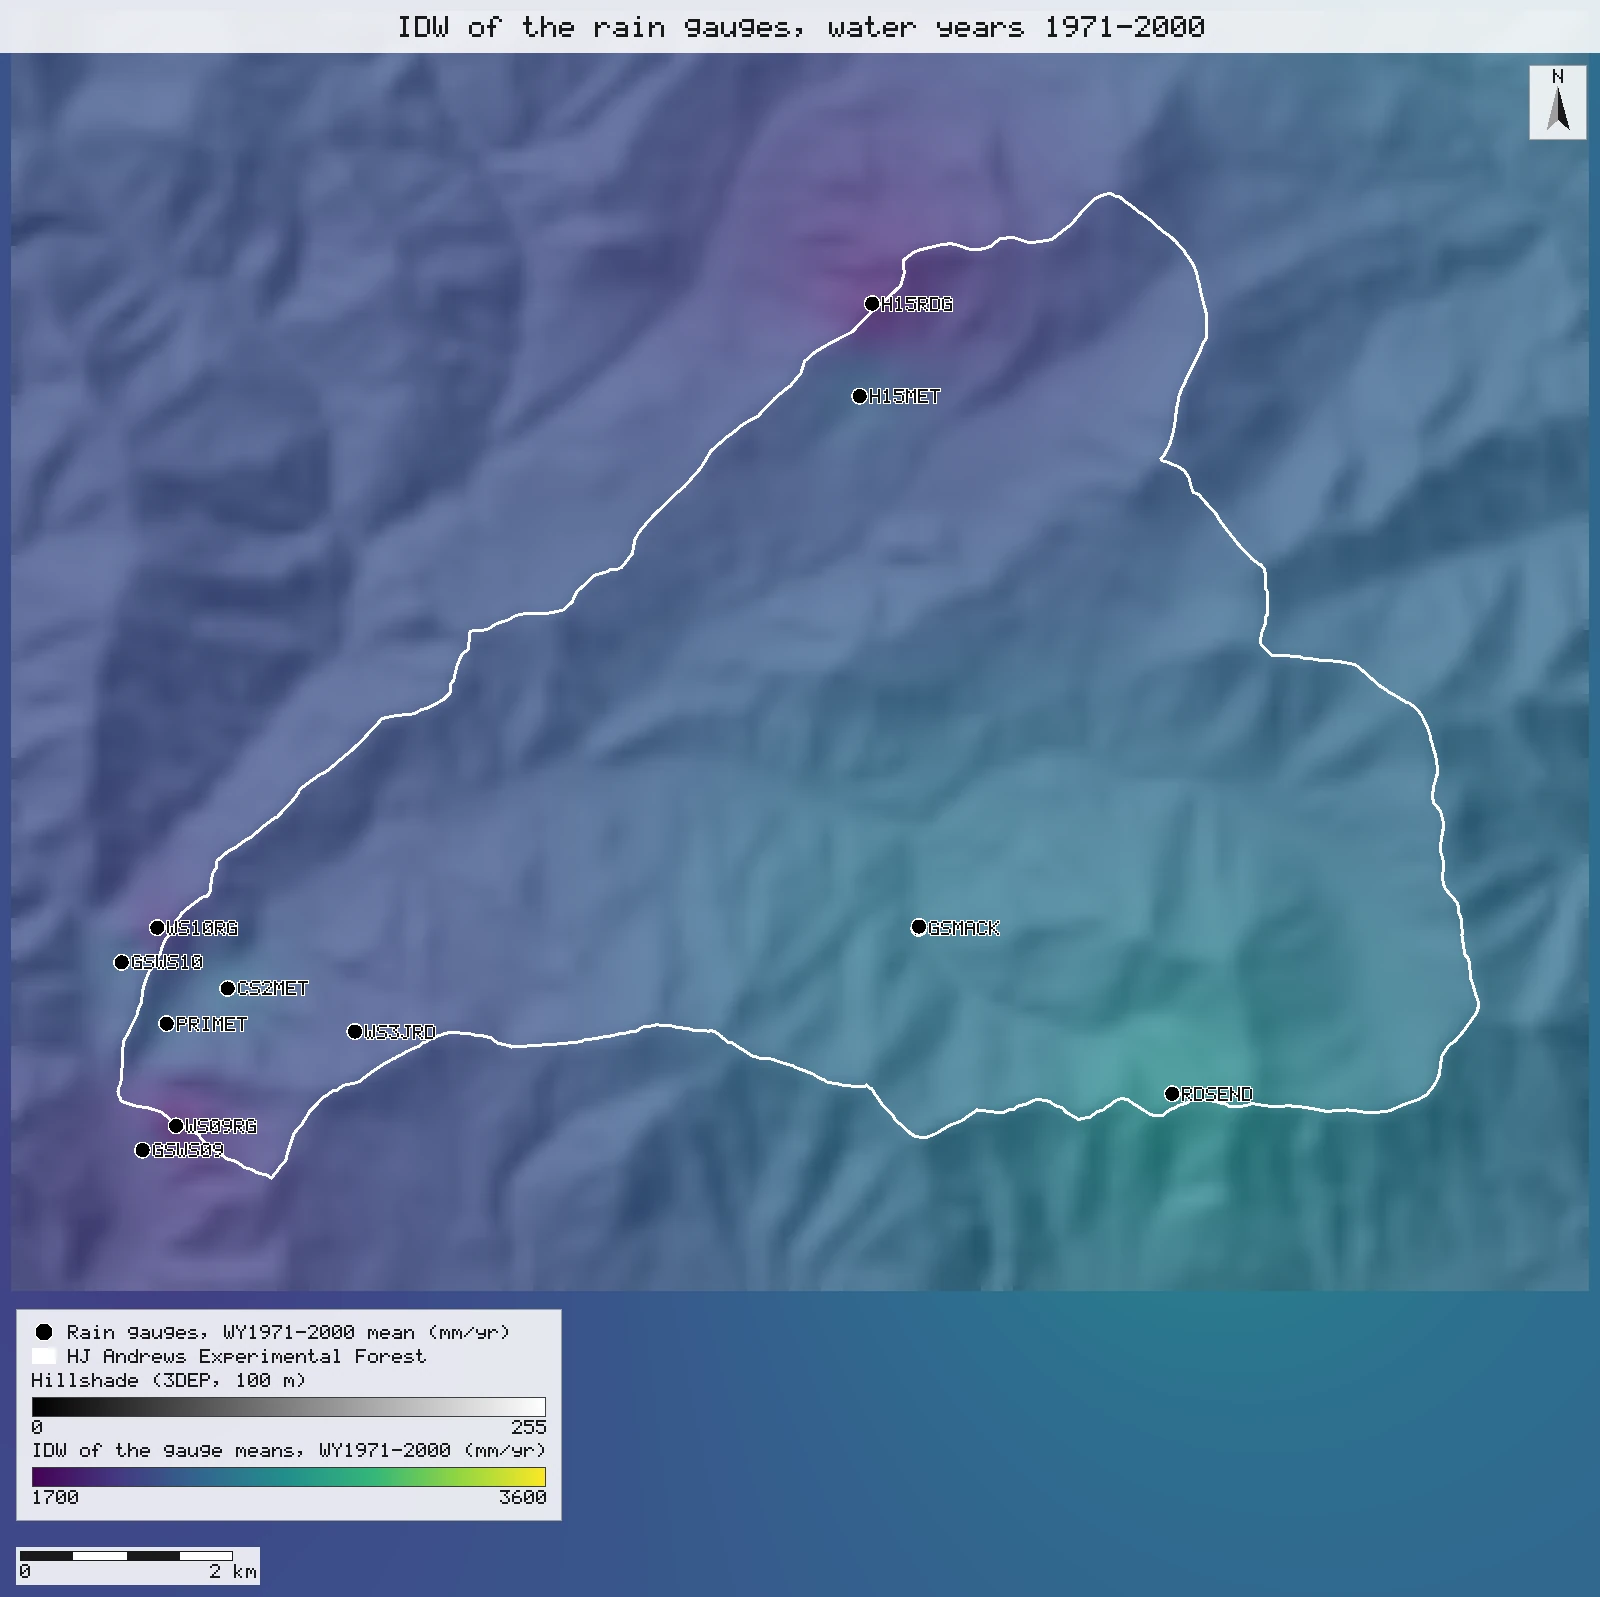
| IDW of the 13 long-record gauges, water years 1971–2000 | 25,479 | 2,289 | 1,839 | 2,619 |
| IDW minus PRISM 1971–2000 | 25,479 | −9 | −542 | +217 |
| PRISM 1991–2020 normals (800 m) | 102 | 2,311 | 2,018 | 2,709 |
| PRISM 1980–89 (MS027 ms02714, 100 m), the first grid | 6,370 | 2,509 | 1,960 | 3,519 |
| IDW of the 20 gauges, water years 1980–89 | 6,370 | 2,270 | 1,852 | 2,642 |
| IDW minus PRISM 1980–89 | 6,370 | −240 | −1,201 | +305 |
| Fast Facts, "average annual rainfall" | – | 2,100 | – | – |
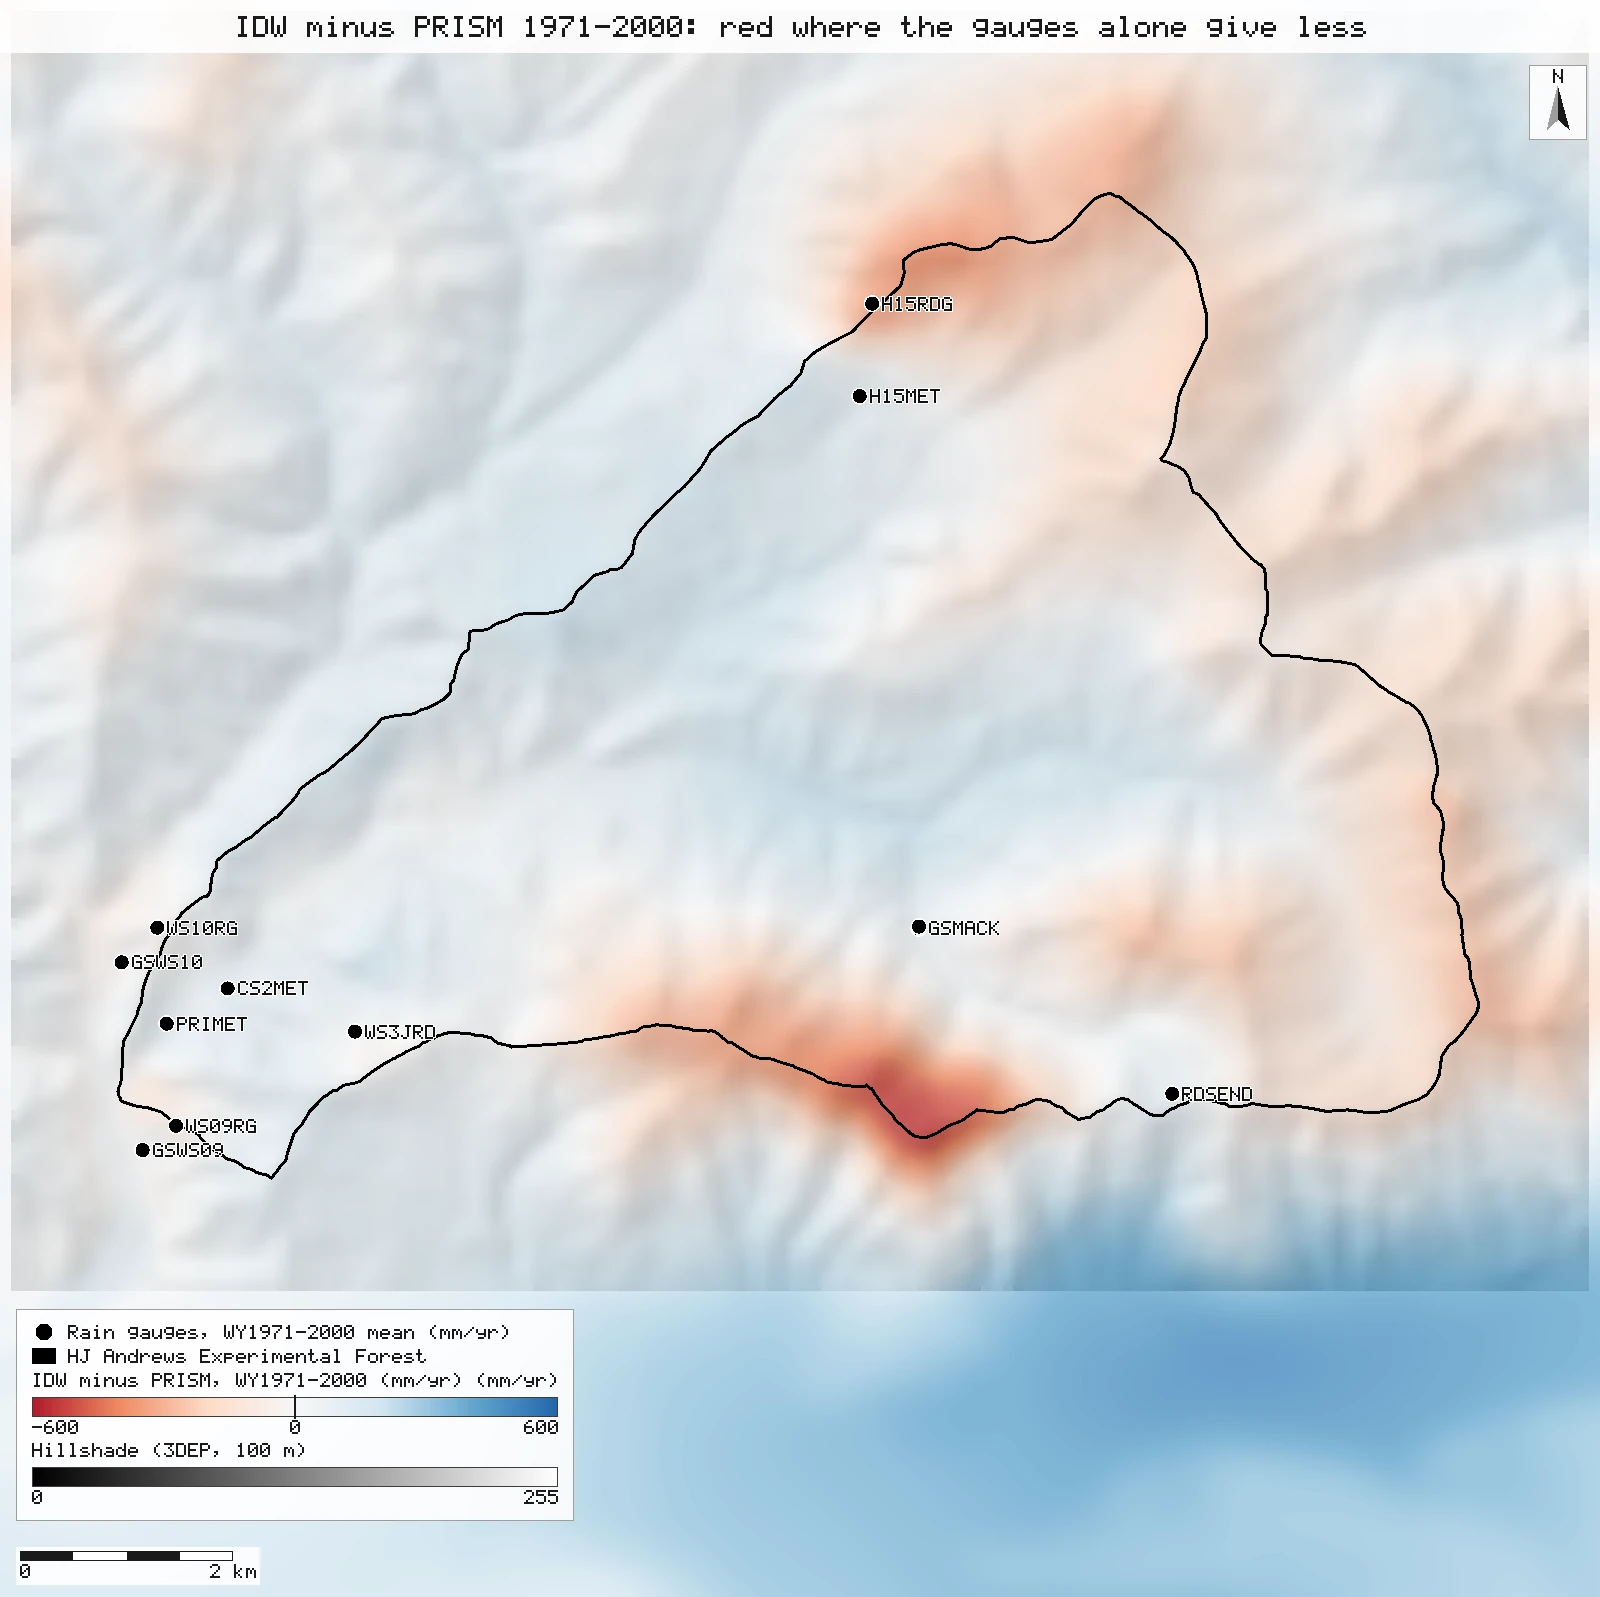
Zonal statistics over the GI006 boundary [66, 67, 70, 73, 173, 102, 105, 108]; for the 800 m normals the boundary is reprojected to the grid's NAD83 geographic coordinates. Units: millimetres per year (ms02727 stores mm × 100 and is divided by 100 in the run). n = cells, as listed.
By elevation
| Elevation band (3DEP, 100 m cells) | Mean elevation (m) | PRISM 1971–2000 | IDW 1971–2000 | IDW minus PRISM | PRISM 1980–89 | IDW minus PRISM 1980–89 | PRISM 1980–89 minus 1971–2000 |
|---|---|---|---|---|---|---|---|
| below 700 m | 599 | 2,114 | 2,209 | +95 (+4.5%) | 2,153 | +22 (+1.0%) | +39 |
| 700–1,000 m | 847 | 2,172 | 2,267 | +95 (+4.4%) | 2,328 | −97 (−4.2%) | +156 |
| 1,000–1,300 m | 1,142 | 2,429 | 2,319 | −110 (−4.5%) | 2,697 | −367 (−13.6%) | +266 |
| 1,300 m and above | 1,399 | 2,559 | 2,378 | −181 (−7.1%) | 3,012 | −657 (−21.8%) | +459 |
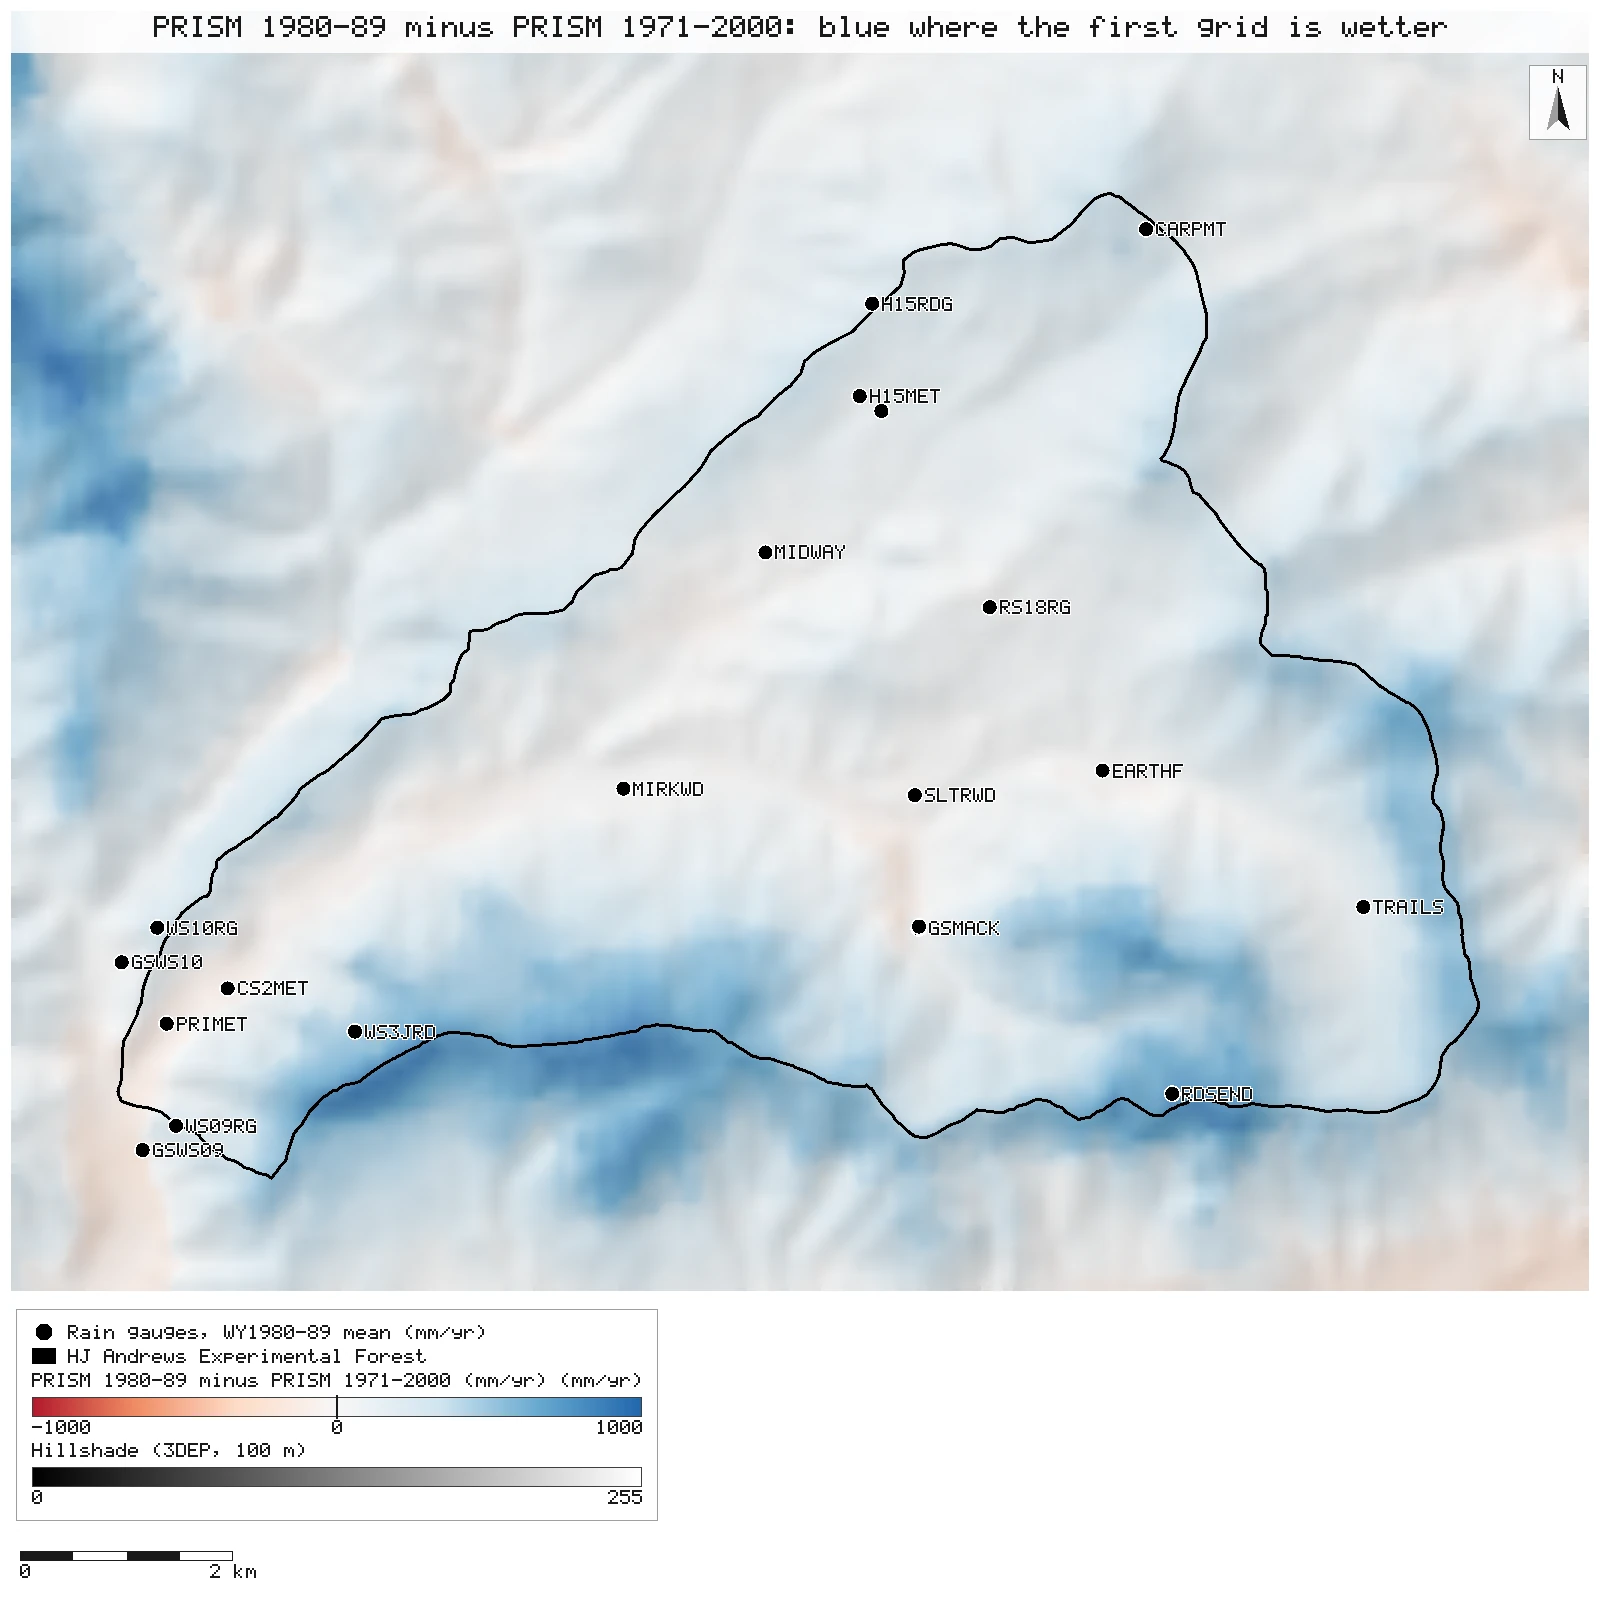
mm/yr. The 3DEP DEM on the 1980–89 grid's cells, reclassified into bands, polygonized, dissolved and cut to the forest boundary [55, 58]; band means by zonal statistics [60, 76, 79, 82, 111, 117, 146] (1971–2000 on its own 50 m cells, 4,532 / 9,303 / 8,078 / 3,566; 1980–89 on 100 m cells, 1,134 / 2,329 / 2,013 / 894). The last column puts the 1971–2000 grid on the 100 m cells (bilinear resample) [137]. Least-squares rise of precipitation with elevation over the forest's 100 m cells: 1.10 mm per metre for 1980–89 against 0.61 for 1971–2000, from zonal means of elevation, precipitation and their centred products [153, 156, 159, 162, 165, 168].
At the long-record gauges, 1971–2000
| Gauge | Type | Elevation (m) | Complete water years | Gauge mean (mm/yr) | PRISM 1971–2000 cell | Gauge minus PRISM | Leave-one-out IDW |
|---|---|---|---|---|---|---|---|
| PRIMET PPTPRI01 | recording | 437 | 21 | 2,247.5 | 2,152 | +4.5% | 2,150 |
| GSWS09 PPTGS901 | standard | 442 | 22 | 2,067.6 | 2,062 | +0.3% | 1,916 |
| GSWS10 PPTGS001 | standard | 475 | 24 | 2,246.0 | 2,261 | −0.6% | 2,095 |
| CS2MET PPTCS201 | standard | 481 | 30 | 2,311.8 | 2,206 | +4.8% | 2,141 |
| WS09RG PPTWS901 | storage | 637 | 23 | 1,832.0 | 1,891 | −3.1% | 2,113 |
| WS10RG PPTWS001 | storage | 639 | 22 | 2,002.4 | 2,030 | −1.4% | 2,235 |
| GSMACK PPTGSM01 | standard | 768 | 16 | 2,440.9 | 2,371 | +2.9% | 2,419 |
| GSMACK PPTGSM02 | recording | 783 | 22 | 2,418.9 | 2,371 | +2.0% | 2,441 |
| WS3JRD PPTJRD02 | storage | 841 | 22 | 2,148.4 | 2,123 | +1.2% | 2,171 |
| H15MET PPTH1501 | standard | 902 | 30 | 2,259.1 | 2,172 | +4.0% | 1,941 |
| H15RDG PPTRDG02 | storage | 1,104 | 22 | 1,878.7 | 2,216 | −15.2% | 2,269 |
| RDSEND PPTRDS01 | storage | 1,330 | 21 | 2,618.5 | 2,545 | +2.9% | 2,335 |
| RS13RG PPTO1301 | storage | off the DEM | 19 | 3,003.1 | 2,896 | +3.7% | 2,183 |
Gauge means from the water-year table, the completeness rule and the join onto the inventory points [14, 87]; PRISM and elevation are the cell holding each gauge. Mean gauge minus PRISM +14 mm (+0.5%), mean absolute 81 mm, root mean square 115 mm, n = 13 [93]; by type [95]: storage −2.0% (n = 6), standard +2.3% (n = 5), recording +3.2% (n = 2). Last column: each gauge predicted by IDW from the other 12 [64]; leave-one-out bias −82 mm, mean absolute error 228 mm, root mean square 307 mm (n = 13) [63].
The 1980–89 gauges against both grids
| Gauge | Type | Elevation (m) | Gauge, WY1980–89 (mm/yr) | PRISM 1980–89 cell | Gauge minus PRISM 1980–89 | PRISM 1971–2000 cell | Gauge minus PRISM 1971–2000 |
|---|---|---|---|---|---|---|---|
| PRIMET PPTPRI01 | recording | 437 | 2,234.7 | 2,037 | +9.7% | 2,152 | +3.9% |
| GSWS09 PPTGS901 | standard | 442 | 2,116.8 | 1,882 | +12.5% | 2,062 | +2.7% |
| GSWS10 PPTGS001 | standard | 475 | 2,316.0 | 2,287 | +1.3% | 2,261 | +2.5% |
| CS2MET PPTCS201 | standard | 481 | 2,265.2 | 2,098 | +8.0% | 2,206 | +2.7% |
| MIRKWD PPTMRK01 | standard | 585 | 2,165.9 | 2,145 | +1.0% | 2,149 | +0.8% |
| WS09RG PPTWS901 | storage | 637 | 1,887.3 | 2,138 | −11.7% | 1,891 | −0.2% |
| WS10RG PPTWS001 | storage | 639 | 1,949.6 | 2,322 | −16.0% | 2,030 | −4.0% |
| SLTRWD PPTSWD01 | standard | 741 | 2,203.0 | 2,180 | +1.1% | 2,199 | +0.2% |
| GSMACK PPTGSM01 | standard | 768 | 2,574.5 | 2,368 | +8.7% | 2,371 | +8.6% |
| MIDWAY PPTMID01 | standard | 775 | 2,047.9 | 2,057 | −0.4% | 2,053 | −0.2% |
| GSMACK PPTGSM02 | recording | 783 | 2,399.5 | 2,354 | +1.9% | 2,371 | +1.2% |
| EARTHF PPTEAR01 | standard | 815 | 2,193.3 | 2,179 | +0.7% | 2,186 | +0.3% |
| WS3JRD PPTJRD02 | storage | 841 | 2,151.0 | 2,639 | −18.5% | 2,123 | +1.3% |
| H15MET PPTH1501 | standard | 902 | 2,228.7 | 2,253 | −1.1% | 2,172 | +2.6% |
| H15PND PPTPND01 | standard | 916 | 2,286.8 | 2,259 | +1.2% | 2,155 | +6.1% |
| TRAILS PPTTRL01 | standard | 1,058 | 2,642.8 | 2,691 | −1.8% | 2,549 | +3.7% |
| RS18RG PPTR1801 | standard | 1,094 | 2,350.4 | 2,347 | +0.1% | 2,313 | +1.6% |
| H15RDG PPTRDG02 | storage | 1,104 | 1,835.8 | 2,409 | −23.8% | 2,216 | −17.2% |
| RDSEND PPTRDS01 | storage | 1,330 | 2,575.0 | 3,322 | −22.5% | 2,545 | +1.2% |
| CARPMT PPTCAR01 | storage | 1,423 | 1,906.7 | 2,621 | −27.3% | 2,398 | −20.5% |
The 20 gauges with every water year 1980–89 complete [22, 122, 134]. Against the 1980–89 grid [130]: storage −20.0% (n = 6, −11.7% to −27.3%), standard +2.6% (n = 12), recording +5.8% (n = 2); overall −113 mm, root mean square 317 mm [128]. Against the 1971–2000 grid [136]: storage −6.6%, standard +2.6%, recording +2.5%. The periods differ, so a few percent either way is climate, not the grid. Leave-one-out IDW of these gauges: root mean square 203 mm, bias +27 mm (n = 20) [98].
The surfaces
What the numbers say, and what they do not
- The answer, against the 1971-2000 grid: the gauges carry the forest mean but not the ridges. IDW of the 13 long-record gauges averages 2,289 mm a year over the forest, 9 mm (0.4%) below PRISM's 2,297 mm. By elevation the sign changes: IDW is 95 mm higher below 700 m and from 700 to 1,000 m, 110 mm lower from 1,000 to 1,300 m, and 181 mm (7.1%) lower above 1,300 m, where few gauges stand. Cell by cell the difference runs from -542 to +217 mm. Predicting each gauge from the other 12 (leave-one-out) gives a root mean square error of 307 mm and a bias of -82 mm; the worst is the wettest gauge, 3,003 mm at Reference Stand 13 on Wildcat Mountain, just north of the forest, predicted 820 mm low: no other gauge is that wet, and IDW cannot rise above its inputs.
- The first grid is the outlier. PRISM 1980-89 averages 2,509 mm over the forest, 212 mm (9.2%) more than the 1971-2000 grid on the same 100 m cells. The two agree in the valleys (+39 mm below 700 m) and part on the ridges (+459 mm above 1,300 m): precipitation rises 1.10 mm per metre of elevation in the first grid against 0.61 in the newer one. HJ Andrews replaced the first grid; its MS027 page says the grids were updated for a longer period and a larger extent. The gauges show no matching wet decade: PRIMET gives 2,234.7 mm for water years 1980-89 and 2,247 mm over its 21 complete water years of 1971-2000. Against the first grid, IDW of the 20 gauges of 1980-89 was 240 mm (9.6%) lower over the forest and 657 mm lower above 1,300 m, which is what an earlier version of this page reported; most of that gap is the first grid's steeper rise with elevation.
- Storage gauges: the earlier 20% shortfall was mostly the first grid. Against the 1980-89 grid all 6 storage gauges read less, by 11.7% to 27.3% (mean -20.0%), while the 12 standard gauges read 2.6% more; an earlier version of this page put this down to catch losses at storage gauges. Against the 1971-2000 grid the same 1980-89 totals read 6.6% less on average: the four storage gauges at Roads End, the WS3 road and watersheds 9 and 10 come within -4.0% to +1.3%, and only the two summit gauges still read low, Carpenter Mountain by 20.5% and Hi-15 Ridge by 17.2%, exposed sites where wind commonly reduces catch. The 13 long-record gauges read 0.5% more than the 1971-2000 grid on average (bias +14 mm, root mean square 115 mm), the 6 storage gauges among them 2.0% less, with Hi-15 Ridge lowest at -15.2%. PRISM is not independent of these gauges, so close agreement at them is partly built in. Mack Creek's two gauges, 17 m apart, give 2,574.5 mm (standard) and 2,399.5 mm (recording) for 1980-89; both are kept.
- Fast Facts, 2.1 m. "7 feet" to the nearest foot spans 1.98 to 2.29 m. The current forest-wide estimates sit at its upper edge: IDW of the gauges 2.29 m, PRISM 1971-2000 2.30 m and the PRISM 1991-2020 normals at 800 m 2.31 m (102 cells), 7.5 to 7.6 feet; the first grid, 2.51 m (8.2 feet), is well beyond it. So the published figure is about 0.2 m below every current forest mean, against 0.41 m below the first grid. Where "7 feet (2.1 meters)" comes from remains unknown: the page gives no place, period or source, and we found none. Valley gauges such as PRIMET (2.23 to 2.25 m) are closer to it than any forest mean, so an earlier version of this page read it as a low-elevation gauge figure; that stays possible but unproven. As an outside check, not part of the recorded run, Daymet v4 at the 102 cell centres gives 2,100 mm for water years 1980-89, the published figure, though Daymet runs lower than every PRISM grid here.
- PRIMET, 2,302 mm. The climate diagram covers 1972-84; our PRIMET gauge (PPTPRI01) gives 2,234.7 mm for water years 1980-89 and 2,247 mm over its complete water years of 1971-2000, 2.9% and 2.4% less. The gauge's record starts in 1979, so it shares only five years (1980-84) with the diagram. PRISM's 1980-89 cell at PRIMET holds 2,037 mm: PRISM's value is its regression for the whole cell, not a reading at the gauge.
Replay it yourself
The run file records every call, its arguments, the checksums of the files it read and the numbers it returned. Replaying it repeats every call in a fresh NativeGIS session and checks that each answer comes out the same.
- Make an empty data folder and fetch the inputs into it exactly as below (bash; the folder layout is the one the run file expects):
cd /path/to/an/empty/folder
mkdir -p samples/hja-open/ms02727 && curl -fL -o samples/hja-open/ms02727/ms02727.zip https://andrewsforest.oregonstate.edu/sites/default/files/lter/data/studies/spatialdata/ms02727.zip && unzip -o samples/hja-open/ms02727/ms02727.zip -d samples/hja-open/ms02727/x
mkdir -p samples/hja-open/ms02714 && curl -fL -o samples/hja-open/ms02714/ms02714.zip https://andrewsforest.oregonstate.edu/sites/default/files/lter/data/studies/spatialdata/ms02714.zip && unzip -o samples/hja-open/ms02714/ms02714.zip -d samples/hja-open/ms02714/x
mkdir -p samples/prism-normals && curl -fL -o samples/prism-normals/prism_ppt_us_30s_2020_avg_30y.zip https://data.prism.oregonstate.edu/normals/us/800m/ppt/monthly/prism_ppt_us_30s_2020_avg_30y.zip && unzip -o samples/prism-normals/prism_ppt_us_30s_2020_avg_30y.zip -d samples/prism-normals/x
mkdir -p samples/hja-open/ms004 && curl -fL -o samples/hja-open/ms004/MS00401_v1.csv https://andrewsforest.oregonstate.edu/sites/default/files/lter/fsdbdata/cache/MS00401_v1.csv
mkdir -p samples/hja-open/ms004 && curl -fL -o samples/hja-open/ms004/MS00403_v9.csv https://andrewsforest.oregonstate.edu/sites/default/files/lter/fsdbdata/cache/MS00403_v9.csv
mkdir -p samples/hja-open/ms004 && curl -fL -o samples/hja-open/ms004/MS00404_v3.csv https://andrewsforest.oregonstate.edu/sites/default/files/lter/fsdbdata/cache/MS00404_v3.csv
mkdir -p samples/hja-open/gi00601 && curl -fL -o samples/hja-open/gi00601/gi00601.zip https://andrewsforest.oregonstate.edu/sites/default/files/lter/data/studies/spatialdata/gi00601.zip && unzip -o samples/hja-open/gi00601/gi00601.zip -d samples/hja-open/gi00601/x
mkdir -p samples/dem3dep && curl -fL -o samples/dem3dep/hja_prism_grid_26910_100m.tif 'https://elevation.nationalmap.gov/arcgis/rest/services/3DEPElevation/ImageServer/exportImage?bbox=557887.02595787,4893065.8803265,572887.02595787,4905265.8803265&bboxSR=26910&imageSR=26910&size=150,122&format=tiff&pixelType=F32&noData=-9999&interpolation=RSP_BilinearInterpolation&compression=None&f=image'
- Download run.json (342,297 bytes, sha256
7dbce51cddd2e893be7784850f65380e9d265ec18af5cf48438efd22f36eaabb). - Ask your assistant to replay it with NativeGIS, or call the tool directly:
gis_replay {"action": "replay",
            "file": "<absolute path to the run.json you downloaded>",
            "inputRoot": "<your data folder>",
            "outputRoot": "<a new, empty folder>"}
Paths in the run file are relative to the data folder (inputRoot), and outputs go under outputRoot, so nothing depends on where the original run lived.
Files
- run.json: the recorded run: every call, its arguments and the numbers it returned
- hja_gauge_water_years_1971_2000.csv: daily precipitation binned by gauge and water year, written by tools/repro/hja-precip-gauge-means.js from the public daily files (same sha256 as in run.json)
Limits
- Gauges kept for 1971-2000 need 15 of the 30 water years complete, so each gauge's mean covers its own years; only 2 gauges have all 30. The 1980-89 gauges all cover the whole decade.
- Gauge totals are as reported, including HJ Andrews' estimated days; no catch correction for wind or snow is applied.
- IDW parameters (power 2, 12 nearest) are the common defaults; other choices change the surface between gauges but cannot add the rise with elevation. Leave-one-out errors are reported for both periods.
- Elevation and the hillshade come from a 100 m export of the 3DEP DEM on the 1980-89 grid's cells, so they smooth summits and valley floors; gauge elevations are cell values, not surveyed heights. The rise with elevation and the grid difference use the 1971-2000 grid resampled to those cells (bilinear); its forest mean there is the same to the millimetre as on its own 50 m cells.
- The ms02727 metadata gives a time period of 1970 to 2010 while its title and readme say 1971-2000; we take the title.
- The 800 m normals are averaged over the 102 cells whose centre is inside the boundary, not weighted by the area each cell has inside it; they are for 1991-2020.
- The water-year binning runs outside NativeGIS by a committed script (see Method); NativeGIS reproduces its totals from the daily files in the same run.