The Lookout Creek stream network, derived from a terrain model and checked against HJ Andrews' stream maps
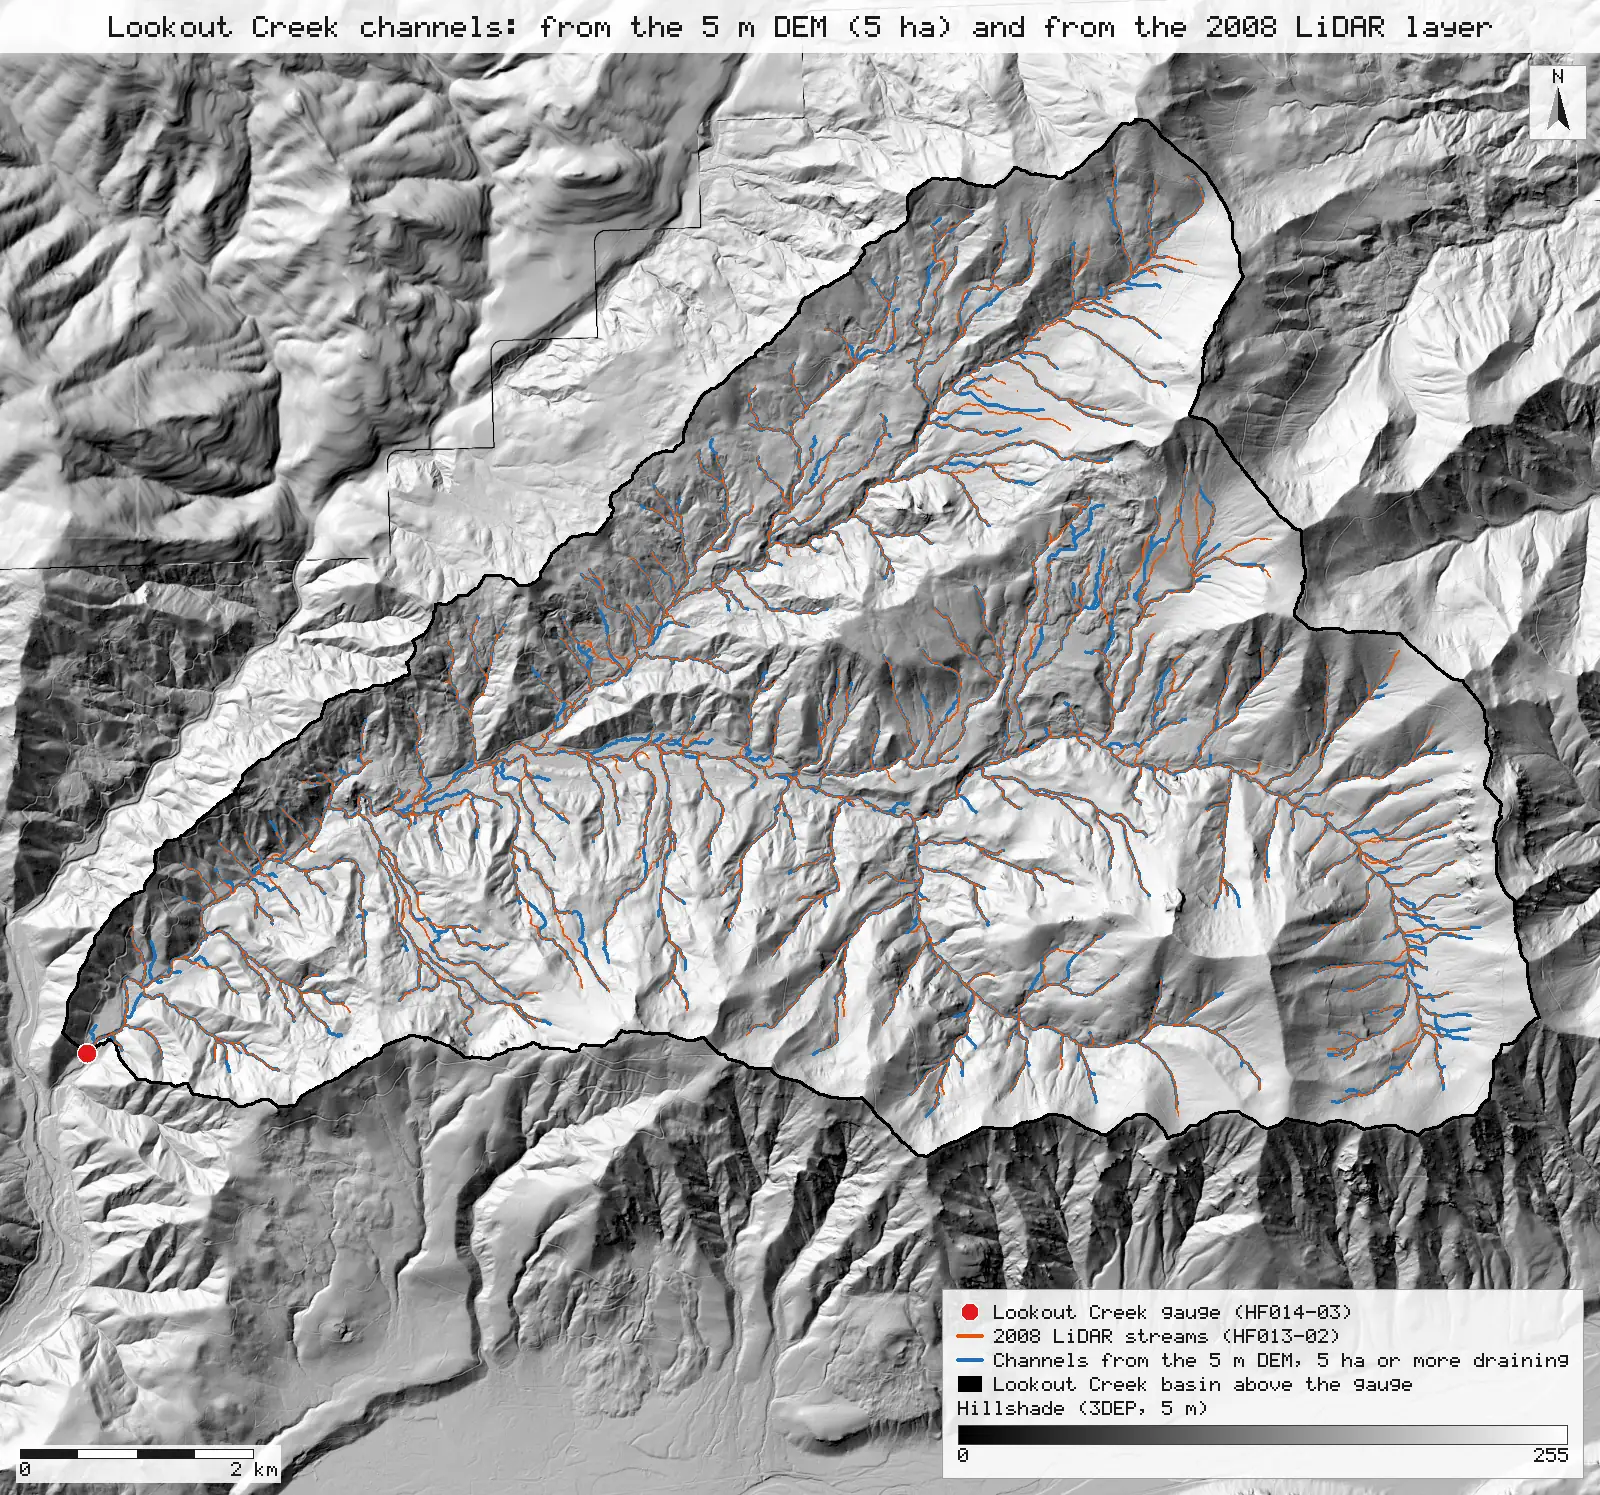
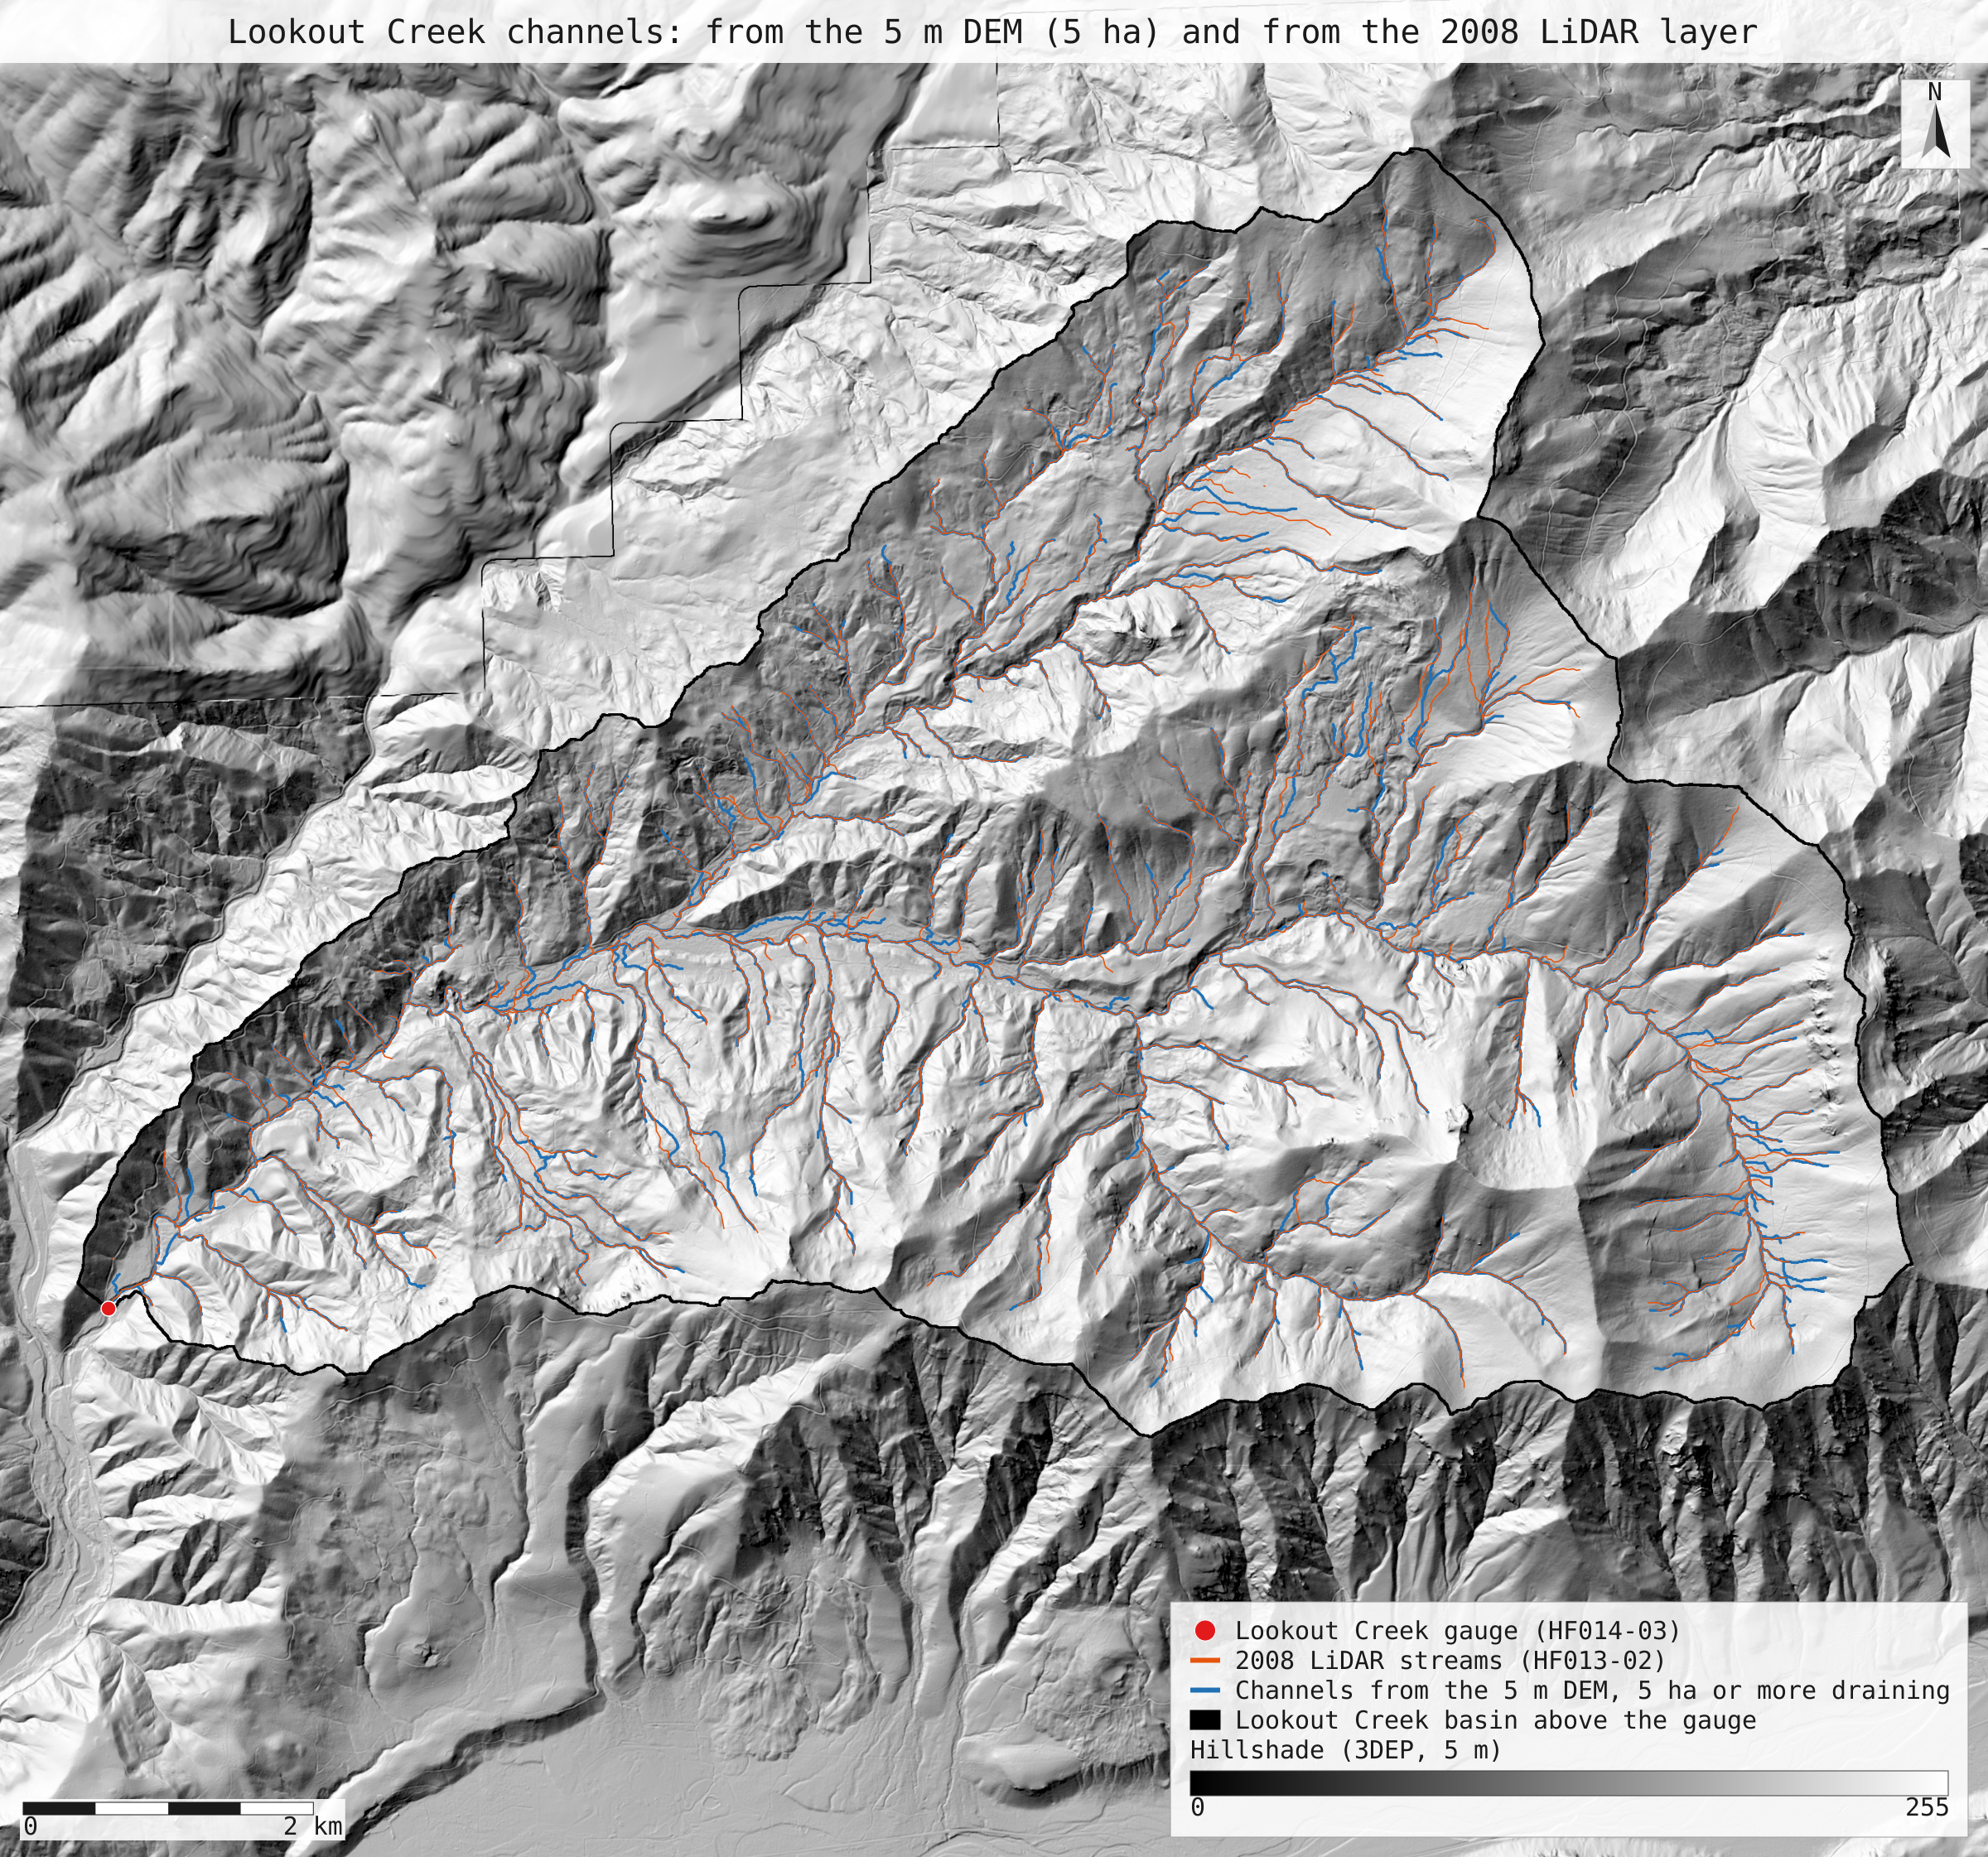
A stream network traced from a public 5 m terrain model makes Lookout Creek a 5th-order basin, as both HJ Andrews stream maps do, when channels start at 5 to 10 ha of contributing area. At the 5 ha threshold, 94% of the 2008 LiDAR map's channel length lies within 30 m of a derived channel.
- Highest order: 2008 layer, DEM channels from 5 ha5 → 5 0match
- Highest order: 1976 survey, DEM channels from 10 ha5 → 5 0match
- Basin above the Lookout Creek gauge≈ 6,400 ha → 6,240.3 ha −159.7 ha (−2.5%)within tolerance
- HF013-02 (2008 LiDAR) against channels from 5 ha204.1 km → 220.19 km +16.1 km (+7.9%)within tolerance
- HF013-01 (1976 survey) against channels from 10 ha140.9 km → 154.24 km +13.3 km (+9.5%)within tolerance
- 2008 layer within 30 m of channels from 5 ha93.6%new
- Channels from 5 ha within 30 m of the 2008 layer91.9%new
- 1976 survey within 30 m of channels from 10 ha66.8%new
- 1976 survey within 30 m of the 2008 layer74.5%new
[19, 21]
[48]
[19, 29]
Numbers in brackets, like [14], are step numbers in this study's run.json: the NativeGIS call that returned the figure. NativeGIS 0.3.0, recorded 2026-10-31 10:13 UTC.
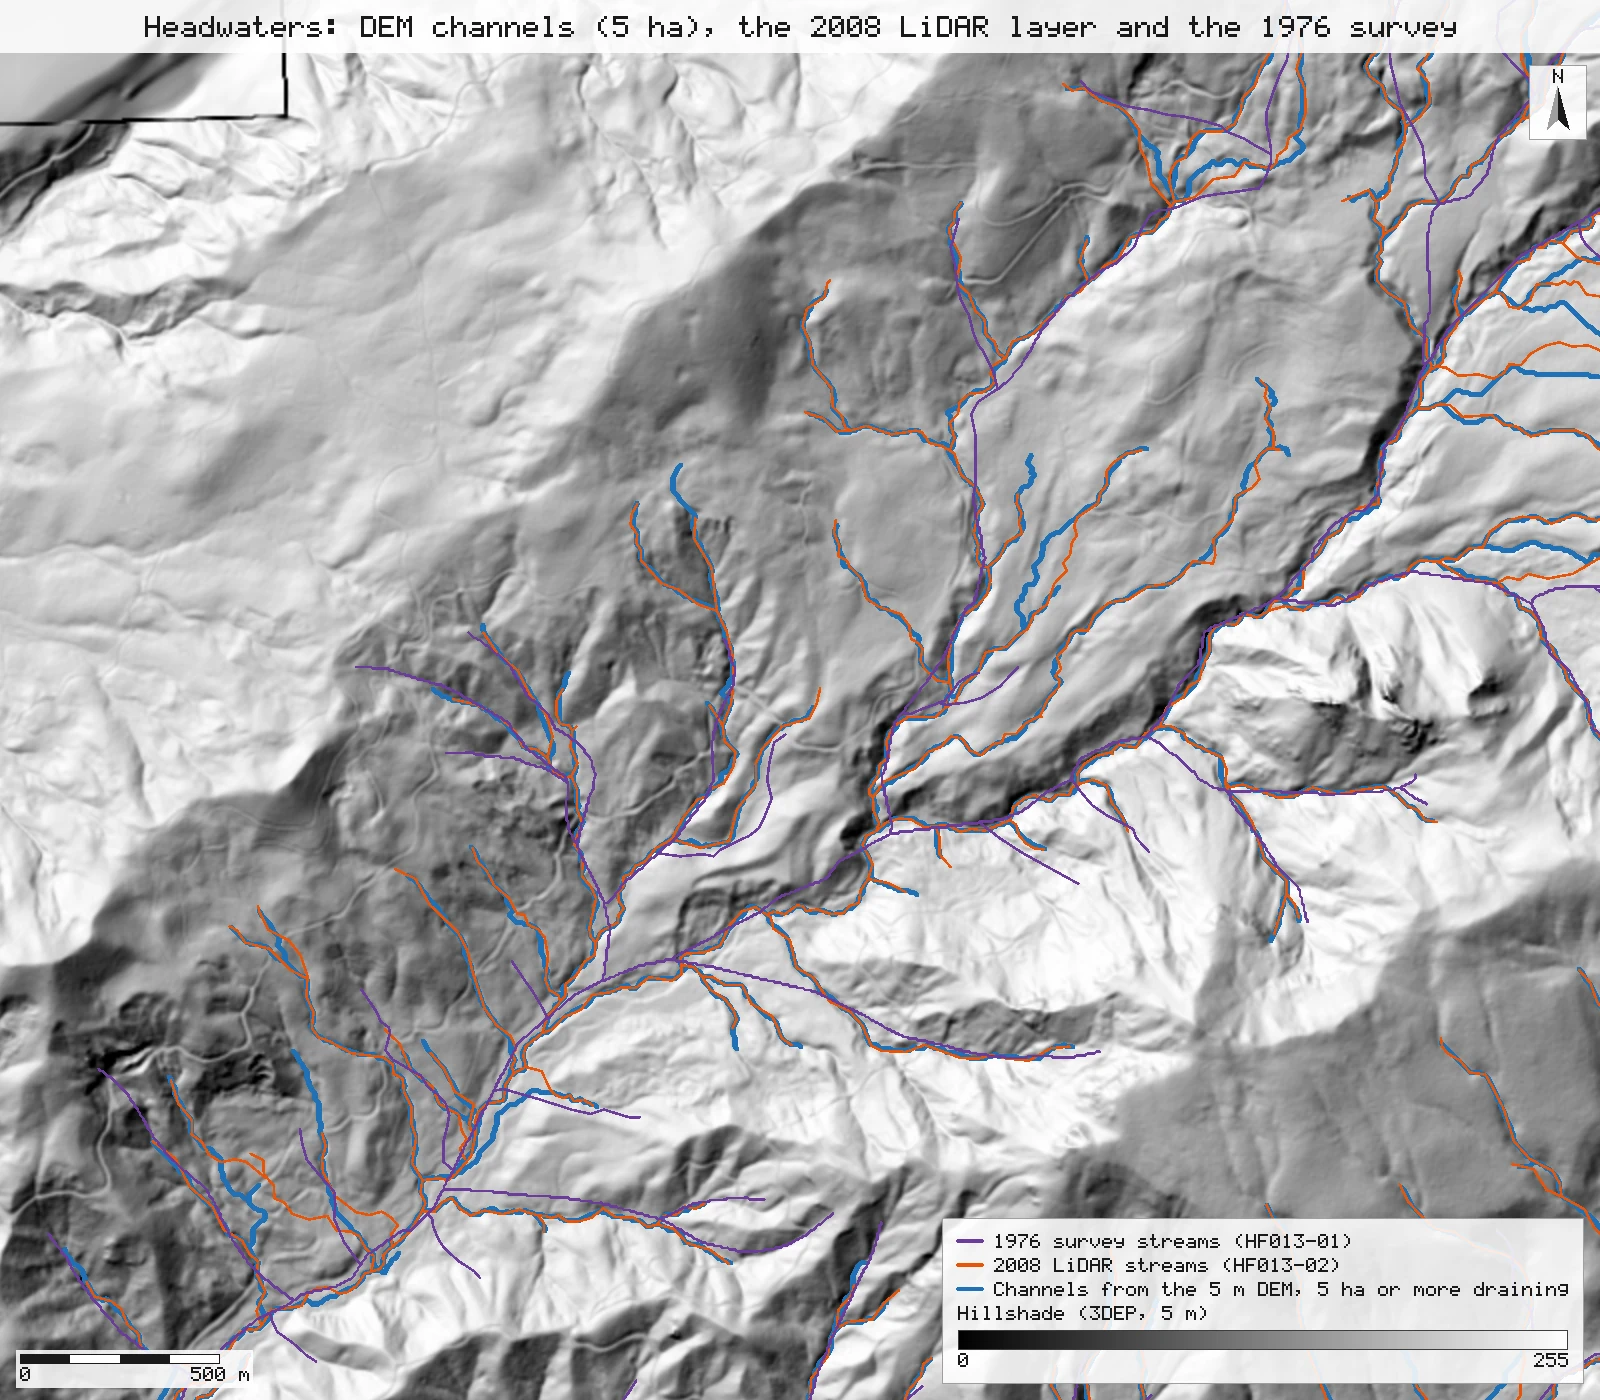
Tributaries north of the main stem, close up
A 4 by 3.5 km window at 1.7 m per pixel: the derived channels (blue, 5 ha), the 2008 LiDAR layer (orange) and the 1976 survey (purple). The 2008 layer and the derived channels follow the same valley floors and part mostly at channel heads; the 1976 lines run straighter, leave the valley floors in places, and start and stop at different heads from both.
Click or tap a map to open it full screen, then zoom and pan.
What was published
HJ Andrews publishes two stream maps of the Experimental Forest. HF013-02 was generated from the 2008 LiDAR 1 m bare-earth DEM with desktop hydrography tools, corrected by hand for culverts, with "Type 2 streams" (channels without water) removed, then simplified and smoothed; Keith Olsen added Strahler order by hand in 2015. HF013-01 is George Lienkaemper's 1976 field survey, drawn on 4-inch-to-the-mile maps, with order added by program and hand-checked for 5th order. Both layers carry a highest order of 5 for Lookout Creek. Fast Facts says the Forest "covers the entire 15,800-acre (6400-ha) drainage basin of Lookout Creek". The lengths below are the published layers' own lines, measured by NativeGIS inside the basin delineated above the Lookout Creek gauge.
EDI record for HF013 · HJ Andrews Fast Facts · HJ Andrews data catalogue
Published method. Neither layer states the contributing area at which a channel begins: HF013-02's channel heads were edited by hand, and HF013-01's come from where surface water was seen in the field. So there is no published threshold to reproduce. This page derives the network at five stated thresholds and says which lands nearest each layer's total; that choice is a calibration, not a match.
The data and where it came from
All of it is open: downloaded without an account or a form.
| Data | Where | Licence |
|---|---|---|
| USGS 3DEP elevation, exported as a 5 m DEM (32-bit float GeoTIFF, EPSG:26910) over the Lookout Creek basin, the same window as R14's 8 m export | USGS National Map 3DEP elevation image service (exportImage), no form or account; the service can answer 502 or 504 under load, and a retry succeeds https://elevation.nationalmap.gov/arcgis/rest/services/3DEPElevation/ImageServer | US federal data, public domain |
| Stream gauges, GPS survey 2009 (HF014-03, strgage_09.shp): the Lookout Creek gauge, GSLOOK | HJ Andrews LTER, zip, no form or account https://andrewsforest.oregonstate.edu/sites/default/files/lter/data/studies/spatialdata/hf01403.zip | HJ Andrews data policy (CC BY, acknowledgement requested) |
| Streams from the 2008 LiDAR DEM (HF013-02, lidar_stream.shp, 1,100 lines, Str_order) | HJ Andrews LTER, 356 kB zip, no form or account https://andrewsforest.oregonstate.edu/sites/default/files/lter/data/studies/spatialdata/hf01302.zip | HJ Andrews data policy (CC BY, acknowledgement requested) |
| Streams, 1976 survey (HF013-01, hydro.shp, 347 lines, ORDER_) | HJ Andrews LTER, 321 kB zip, no form or account https://andrewsforest.oregonstate.edu/sites/default/files/lter/data/studies/spatialdata/hf01301.zip | HJ Andrews data policy (CC BY, acknowledgement requested) |
| HJ Andrews Experimental Forest boundary (GI006, boundary83.shp), for the forest-wide density | HJ Andrews LTER, zip, no form or account https://andrewsforest.oregonstate.edu/sites/default/files/lter/data/studies/spatialdata/gi00601.zip | HJ Andrews data policy (CC BY, acknowledgement requested) |
The input files the run read, pinned by checksum
| File (relative to the data folder) | Bytes | sha256 |
|---|---|---|
samples/dem3dep/lookout_creek_26910_5m.tif | 30,282,506 | e64475f3e49eeaef… |
samples/hja-open/hf01403/x/strgage_09.shp | 460 | 152fd9ab937657c2… |
samples/hja-open/hf01302/x/lidar_stream.shp | 160,332 | 70ac82b1e6bf3dc7… |
samples/hja-open/hf01301/x/hydro.shp | 173,308 | 263271acd998f7bd… |
samples/hja-open/gi00601/x/boundary83.shp | 10,540 | 0774de0a9ebd9693… |
Full checksums are in run.json. Replay refuses an input whose checksum differs.
Method
- Open the 5 m 3DEP DEM, the Lookout Creek gauge (HF014-03, SITECODE GSLOOK) and the two HJ Andrews stream layers.
- Fill depressions (gis_process fill, Priority-Flood), then D8 flow direction on the filled DEM (flowDirection).
- Delineate the basin above the gauge (watershed), moving the gauge to the nearest cell within 30 m that drains at least 2 ha, as in R14. Keep the flow directions inside the basin only (clip), so every derived channel drains to the gauge, and check the contributing area at the outlet (flowAccumulation).
- Derive channel links with Strahler order at contributing-area thresholds of 1, 2, 5, 10 and 20 ha (streams); each step reports the length by order.
- Clip both published layers to the basin, measure their lines and sum the length by their own order field (measure, summarize). Sum the whole files too, both the stored length fields and the measured lines.
- Channel positions: buffer the derived channels by 30 m (dissolved) and measure how much of the published layer falls inside, and the converse, at the threshold nearest each layer's total (5 ha for 2008, 10 ha for 1976); and the 1976 survey within 30 m of the 2008 layer. Lines are simplified to 2.5 m (half a cell, gis_process simplify) before buffering, and the derived links are measured simplified on the converse side, which takes out the D8 stair-steps.
- Render the maps as SVG over a hillshade of the same DEM; record the run and replay it in a fresh session.
The run made 53 NativeGIS calls: gis_open × 5, gis_query × 6, gis_process × 38, gis_render × 4.
Published numbers next to ours
Length by Strahler order
| Network | Order 1 | 2 | 3 | 4 | 5 | 6 | Total (km) | Source |
|---|---|---|---|---|---|---|---|---|
| HF013-02, 2008 LiDAR (published) | 120.8 (59.2%) | 48.0 (23.5%) | 18.1 (8.9%) | 11.2 (5.5%) | 6.0 (3.0%) | – | 204.1 | Str_order [29, 32] |
| HF013-01, 1976 survey (published) | 86.8 (61.6%) | 31.8 (22.6%) | 9.6 (6.8%) | 6.6 (4.7%) | 6.1 (4.3%) | – | 140.9 | ORDER_ [37, 40] |
| Derived, 1 ha | 250.0 (51.6%) | 120.5 (24.9%) | 65.1 (13.5%) | 26.1 (5.4%) | 11.9 (2.5%) | 10.4 (2.1%) | 484.0 | 3,403 links [15] |
| Derived, 2 ha | 178.5 (52.5%) | 89.8 (26.4%) | 38.8 (11.4%) | 15.0 (4.4%) | 11.7 (3.4%) | 6.4 (1.9%) | 340.1 | 1,693 links [17] |
| Derived, 5 ha (nearest 2008) | 119.1 (54.1%) | 55.0 (25.0%) | 26.8 (12.2%) | 8.8 (4.0%) | 10.4 (4.7%) | – | 220.2 | 712 links [19] |
| Derived, 10 ha (nearest 1976) | 90.4 (58.6%) | 35.7 (23.2%) | 10.0 (6.5%) | 11.7 (7.6%) | 6.4 (4.2%) | – | 154.2 | 353 links [21] |
| Derived, 20 ha | 61.0 (56.9%) | 25.5 (23.7%) | 10.4 (9.7%) | 10.4 (9.7%) | – | – | 107.3 | 201 links [23] |
Length in km by Strahler order inside the basin delineated above the Lookout Creek gauge (6,240 ha [8, 10]), with each order's share of the network in brackets. Published lengths are the layers' own lines, clipped to the basin and measured; derived lengths join D8 cell centres on the 5 m DEM. Units: km in NAD83 / UTM zone 10N (EPSG:26910).
Total length and drainage density across thresholds
| Network inside the basin | Length (km) | Drainage density (km/km²) | Highest order | Source |
|---|---|---|---|---|
| HF013-02, 2008 LiDAR | 204.1 | 3.27 | 5 | [29, 32] |
| HF013-01, 1976 survey | 140.9 | 2.26 | 5 | [37, 40] |
| Derived, channels start at 1 ha | 484.0 | 7.76 | 6 | [15] |
| Derived, channels start at 2 ha | 340.1 | 5.45 | 6 | [17] |
| Derived, channels start at 5 ha | 220.2 | 3.53 | 5 | [19] |
| Derived, channels start at 10 ha | 154.2 | 2.47 | 5 | [21] |
| Derived, channels start at 20 ha | 107.3 | 1.72 | 4 | [23] |
Drainage density is length over the basin's 62.4 km². The derived total falls from 484.0 km at 1 ha to 107.3 km at 20 ha. Calibration: of the five thresholds, 5 ha lands nearest the 2008 layer (220.2 km, 7.9% longer) and 10 ha nearest the 1976 survey (154.2 km, 9.4% longer). That is a choice made by looking at the published totals, so these two rows are not an independent check of length.
Whole files, for reference: HF013-02's stored Shape_Leng sums to 213.3 km [28], 3.35 km/km² over the 63.69 km² Experimental Forest [42]; its lines measure 209.8 km [26], so the stored lengths run 1.6% longer than the distributed lines (most likely measured before the lines were simplified and smoothed). HF013-01's stored LENGTH sums to 144.7 km [36] and its lines to 144.7 km [34].
Where the channels are
| Length that has a counterpart within 30 m | Share | How |
|---|---|---|
| HF013-02 (2008) near a channel derived at 5 ha | 93.6% | 191.1 of 204.1 km: the 2008 lines clipped to a 30 m buffer of the derived channels [48] |
| Channels derived at 5 ha near HF013-02 | 91.9% | 197.5 of 214.9 km (the links simplified to 2.5 m [43]) [52] |
| HF013-01 (1976) near a channel derived at 10 ha | 66.8% | 94.2 of 140.9 km [55] |
| Channels derived at 10 ha near HF013-01 | 63.2% | 95.1 of 150.4 km (simplified to 2.5 m [45]) [59] |
| HF013-01 (1976) near HF013-02 (2008) | 74.5% | 105.0 of 140.9 km: the two published layers against each other [60] |
Buffers are 30 m around lines simplified to 2.5 m (half a cell), round-joined and dissolved; lengths are of the lines clipped to them. Simplifying the derived links to 2.5 m takes out the D8 stair-steps: it shortens them by 2.4% at 5 ha. The test asks whether a line has a counterpart nearby, not whether the orders or heads agree.
Why any numbers differ
- Order: Lookout Creek is 5th order when channels start at 5 to 10 ha. Both published layers give the basin a highest order of 5. Derived from the DEM, the basin is 6th order with channels starting at 1 or 2 ha, 5th order at 5 and 10 ha, and 4th order at 20 ha. Strahler order counts junctions, so it rises as the threshold falls and more small channels join; the published order of 5 matches the thresholds whose total lengths also sit nearest the published layers.
- Order shares. First-order channels hold 59.2% of the 2008 layer's length and 54.1% of the network derived at 5 ha; 61.6% of the 1976 survey and 58.6% at 10 ha. The 5th-order main stem is 6.0 km in the 2008 layer and 6.4 km at 10 ha, but 10.4 km at 5 ha, where a 5th-order junction forms higher up the valley. At 5 ha the derived network holds more 3rd-order and less 4th-order length than the 2008 layer: which tributary pairs meet at equal order depends on which small heads exist, and the 2008 layer's heads were edited by hand.
- Length and drainage density are a calibration, not a match. The basin holds 204.1 km of the 2008 layer (3.27 km/km²) and 140.9 km of the 1976 survey (2.26 km/km²). The derived network runs from 484.0 km at 1 ha to 107.3 km at 20 ha. 5 ha lands nearest the 2008 layer (220.2 km, 3.53 km/km², 7.9% longer) and 10 ha nearest the 1976 survey (154.2 km, 2.47 km/km², 9.4% longer). Some of the excess is the D8 zigzag; the published lines were smoothed.
- Channel positions agree closely with the 2008 layer. At 5 ha, 93.6% of the 2008 layer's length lies within 30 m of a derived channel, and 91.9% of the derived length lies within 30 m of the 2008 layer. Both come from LiDAR terrain, so they follow the same valley floors; most of the misses are channel heads that one network extends and the other does not.
- The 1976 survey agrees less, with the DEM and with the 2008 layer alike. At 10 ha, 66.8% of the 1976 survey lies within 30 m of a derived channel, and 63.2% of the derived length within 30 m of the survey; only 74.5% of the survey lies within 30 m of the 2008 layer either. The survey was drawn by hand on 4-inch-to-the-mile maps and later fitted to contours from scanned DEMs, so its lines run straighter and leave the valley floor in places.
- Basin area. The basin delineated on the 5 m DEM is 6,240.3 ha, within 0.3 ha of R14's 8 m delineation (6,240.1 ha), against Fast Facts' rounded 6,400 ha (15,800 acres). HJ Andrews' gauged-watershed table gives 6,242 ha; R14 explains the published figures.
Replay it yourself
The run file records every call, its arguments, the checksums of the files it read and the numbers it returned. Replaying it repeats every call in a fresh NativeGIS session and checks that each answer comes out the same.
- Make an empty data folder and fetch the inputs into it exactly as below (bash; the folder layout is the one the run file expects):
cd /path/to/an/empty/folder
mkdir -p samples/dem3dep && curl -fL -o samples/dem3dep/lookout_creek_26910_5m.tif 'https://elevation.nationalmap.gov/arcgis/rest/services/3DEPElevation/ImageServer/exportImage?bbox=558400,4891600,572400,4904600&bboxSR=26910&imageSR=26910&size=2800,2600&format=tiff&pixelType=F32&noData=-9999&interpolation=RSP_BilinearInterpolation&compression=None&f=image'
mkdir -p samples/hja-open/hf01403 && curl -fL -o samples/hja-open/hf01403/hf01403.zip https://andrewsforest.oregonstate.edu/sites/default/files/lter/data/studies/spatialdata/hf01403.zip && unzip -o samples/hja-open/hf01403/hf01403.zip -d samples/hja-open/hf01403/x
mkdir -p samples/hja-open/hf01302 && curl -fL -o samples/hja-open/hf01302/hf01302.zip https://andrewsforest.oregonstate.edu/sites/default/files/lter/data/studies/spatialdata/hf01302.zip && unzip -o samples/hja-open/hf01302/hf01302.zip -d samples/hja-open/hf01302/x
mkdir -p samples/hja-open/hf01301 && curl -fL -o samples/hja-open/hf01301/hf01301.zip https://andrewsforest.oregonstate.edu/sites/default/files/lter/data/studies/spatialdata/hf01301.zip && unzip -o samples/hja-open/hf01301/hf01301.zip -d samples/hja-open/hf01301/x
mkdir -p samples/hja-open/gi00601 && curl -fL -o samples/hja-open/gi00601/gi00601.zip https://andrewsforest.oregonstate.edu/sites/default/files/lter/data/studies/spatialdata/gi00601.zip && unzip -o samples/hja-open/gi00601/gi00601.zip -d samples/hja-open/gi00601/x
- Download run.json (93,568 bytes, sha256
28e0e0314c3a7d18b8828cb7c3353dc33b525c5ce5823957d48e840790e485ab). - Ask your assistant to replay it with NativeGIS, or call the tool directly:
gis_replay {"action": "replay",
            "file": "<absolute path to the run.json you downloaded>",
            "inputRoot": "<your data folder>",
            "outputRoot": "<a new, empty folder>"}
Paths in the run file are relative to the data folder (inputRoot), and outputs go under outputRoot, so nothing depends on where the original run lived.
Files
- run.json: the recorded run: every call, its arguments and the numbers it returned
- stream_network.svg: the full-detail map
Limits
- The threshold is the one free choice in a DEM-derived network, and neither published layer states one. The 5 ha and 10 ha thresholds are named here because they land nearest the published totals: a calibration. A different threshold moves every length, density and position share on this page.
- D8 channels run from cell centre to cell centre in eight directions, so a line that should run at 22.5° zigzags and measures a few per cent longer than the smoothed published lines.
- The DEM is a public 5 m export of the 3DEP LiDAR terrain. Road fills cross many small channels; the fill step lets water over them, while HF013-02 was corrected by hand to pass culverts. Small channels near roads can sit a few cells apart for that reason.
- The 30 m test asks only whether a line has a counterpart nearby, not whether the two lines carry the same order or start at the same head.