RAVG burn severity for the 2023 Lookout Fire, re-derived from its Sentinel-2 images
A burn-severity map is only as trustworthy as the steps behind it. Starting from the two Sentinel-2 images in RAVG's own download, NativeGIS rebuilds NBR, dNBR, RdNBR and the basal-area loss model, and puts 99.88% of the fire's 117,334 cells in the same loss class as RAVG. The class shares come out at 54.2 / 19.5 / 11.9 / 14.4% against RAVG's 54.1 / 19.6 / 11.8 / 14.4%.
- 0–25% loss18,887 ac → 18,888 ac +1 ac (+0.003%)within tolerance
- 25–50% loss1,623 ac → 1,632 ac +9 ac (+0.5%)within tolerance
- 50–75% loss1,467 ac → 1,460 ac −8 ac (−0.5%)within tolerance
- 75–100% loss3,761 ac → 3,762 ac +2 ac (+0.052%)within tolerance
- Class 1 (0% loss)54.1% → 54.21% +0.1 ptswithin tolerance
- Class 2 (>0 to <25%)19.6% → 19.52% −0.1 ptswithin tolerance
- Class 3 (25 to <75%)11.8% → 11.85% +0.1 ptswithin tolerance
- Class 4 (75–100%)14.4% → 14.42% 0match
[29]
[29]
[16]
Numbers in brackets, like [14], are step numbers in this study's run.json: the NativeGIS call that returned the figure. NativeGIS 0.3.0, recorded 2026-10-31 07:52 UTC.
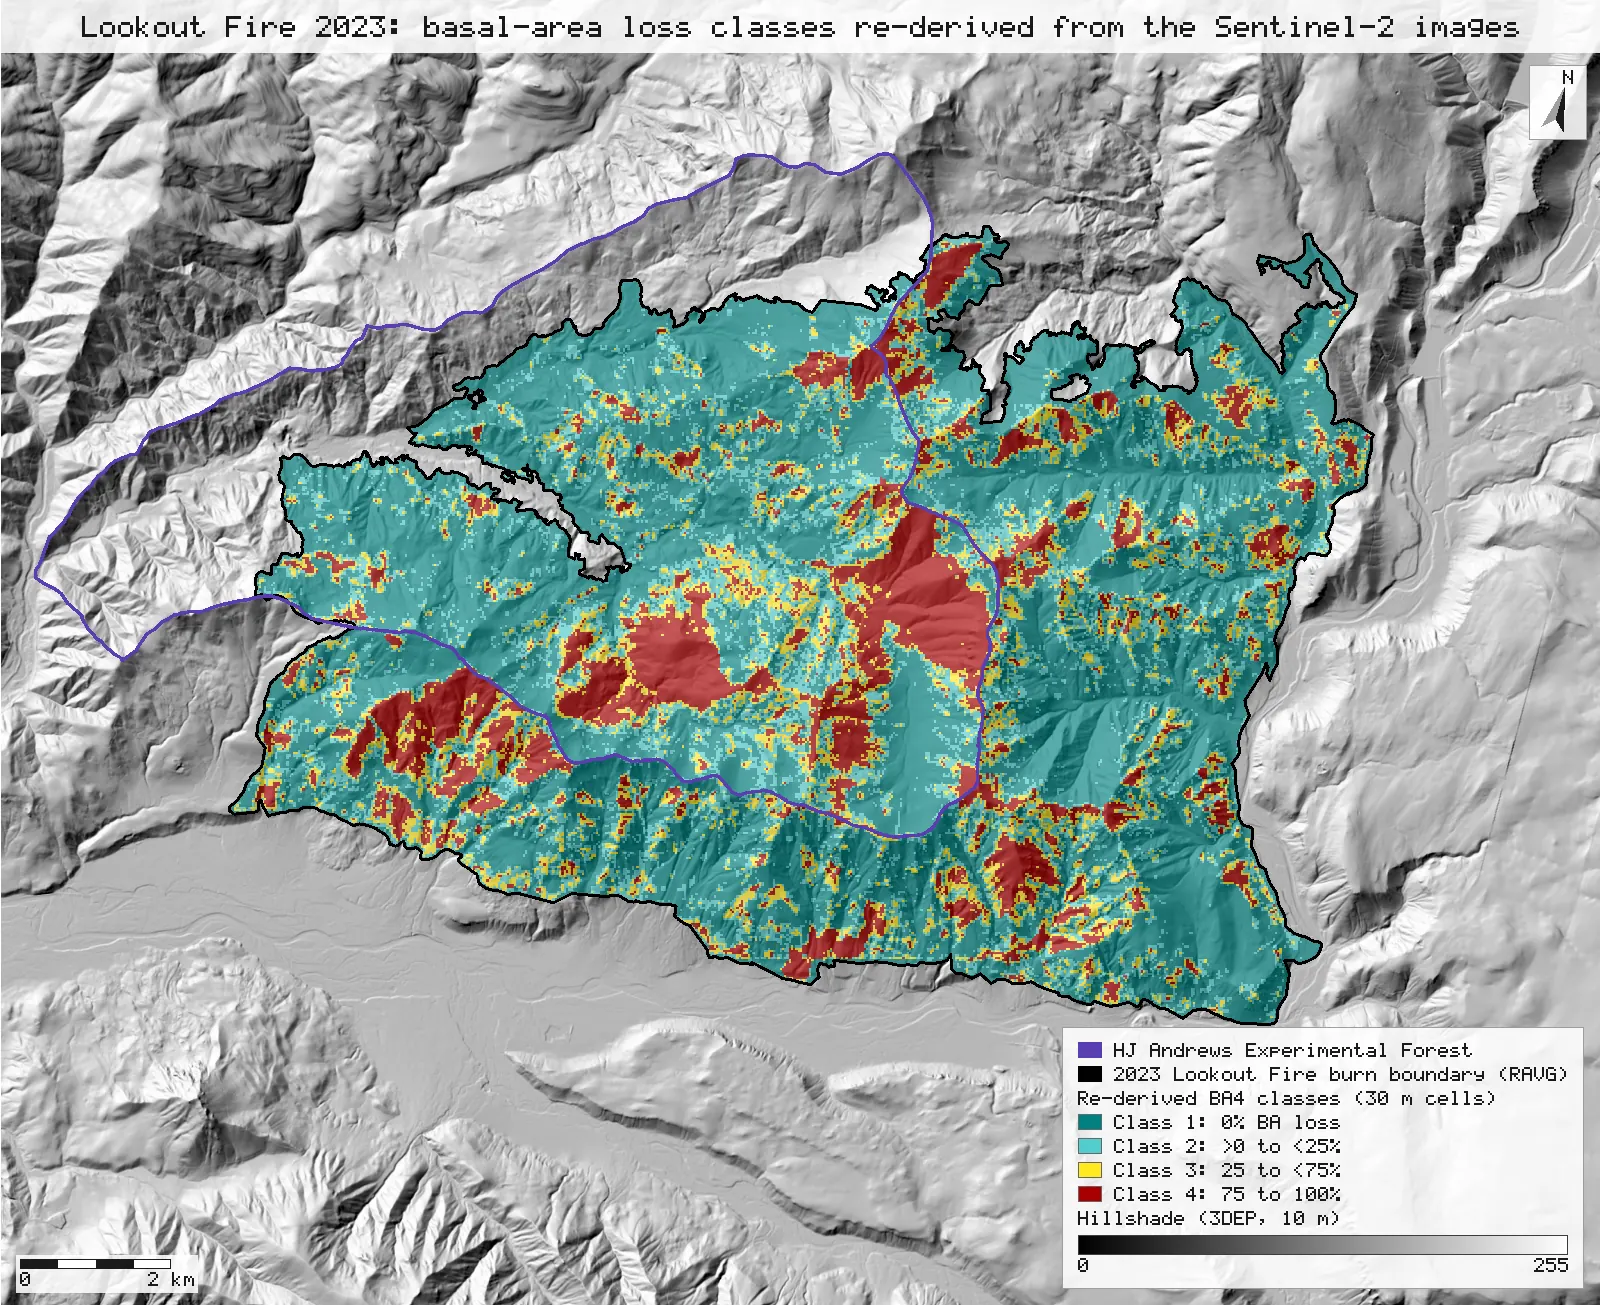
Click or tap a map to open it full screen, then zoom and pan.
What was published
RAVG publishes, for each large fire on forested land, the pre- and post-fire images it used and the severity products it made from them. For the Lookout Fire the bundle holds both Sentinel-2 images as top-of-atmosphere reflectance, "rescaled and converted to integer", bands 1–6 = blue, green, red, NIR, SWIR-1, SWIR-2; its dNBR and RdNBR rasters; continuous percent basal-area (BA) loss; the four-class BA4 product (0% loss, more than 0 but under 25%, 25 to under 75%, 75% or more); and a summary table of acres per BA class. The burn boundary records the assessment type (Initial) and the fire's dNBR offset (dNBR_offst = −15). Over its coded footprint, RAVG's BA4 raster puts 54.1, 19.6, 11.8 and 14.4% of the cells in classes 1 to 4 (the split Dickinson et al. 2026 quote; see R13).
RAVG program and data access · RAVG class codes (FAQ) · Miller et al. 2009 (DOI) · Miller & Quayle 2015 (DOI)
Published method. From the metadata: NBR = (NIR − SWIR)/(NIR + SWIR); dNBR = (PreNBR − PostNBR) × 1000; RdNBR = (dNBR − Offset)/sqrt(abs(PreNBR/1000)), with the offset the mean dNBR of unburned forest near the fire. For an initial assessment the basal-area regression of Miller et al. (2009) is applied to RdNBR/1.144 (Miller & Quayle 2015): %BA loss = 100·sin²((RdNBR/1.144 − 166.5)/389.0). The same adjustment gives CBI = (1/0.389)·ln((RdNBR/1.144 + 369.0)/421.7) and %CC loss = 100·sin²((RdNBR/1.144 − 161.0)/392.6).
The data and where it came from
All of it is open: downloaded without an account or a form.
| Data | Where | Licence |
|---|---|---|
| RAVG initial assessment for fire OR4422212214620230806 (LOOKOUT): the pre- and post-fire Sentinel-2 reflectance (6 bands, 30 m, EPSG:5070), dNBR, RdNBR, continuous BA loss and the BA4 classes, the burn boundary shapefile, metadata and summary tables | USGS EROS / USDA Forest Service RAVG data distribution (the per-fire "Download" link of the RAVG data-access query tool), 9.7 MB zip, no form or account https://edcintl.cr.usgs.gov/downloads/sciweb1/shared/MTBS_Fire/data/ravg/data/or4422212214620230806_20221019_20231019_ravg_data.zip | US federal data, public domain |
| HJ Andrews Experimental Forest boundary (GI006), drawn on the maps for context only | HJ Andrews LTER spatial data, zip, no form or account https://andrewsforest.oregonstate.edu/sites/default/files/lter/data/studies/spatialdata/gi00601.zip | HJ Andrews data policy (open) |
| USGS 3DEP elevation, exported as a 10 m DEM (32-bit float GeoTIFF, EPSG:5070) for the fire's window, as for R13; used only for the maps' hillshade | USGS National Map 3DEP elevation image service (exportImage), no form or account https://elevation.nationalmap.gov/arcgis/rest/services/3DEPElevation/ImageServer | US federal data, public domain |
The input files the run read, pinned by checksum
| File (relative to the data folder) | Bytes | sha256 |
|---|---|---|
samples/ravg-lookout/x/or4422212214620230806_20221019_s2b_refl.tif | 4,669,236 | 14448ffa9f4df245… |
samples/ravg-lookout/x/or4422212214620230806_20231019_s2a_refl.tif | 4,667,724 | 43a8a84a3d07c339… |
samples/ravg-lookout/x/or4422212214620230806_20221019_20231019_dnbr.tif | 780,044 | 65fac9d63377de53… |
samples/ravg-lookout/x/or4422212214620230806_20221019_20231019_rdnbr.tif | 782,186 | 2dc52359b8fe9f68… |
samples/ravg-lookout/x/or4422212214620230806_20221019_20231019_rdnbr_ba.tif | 1,559,426 | 096b17b345571110… |
samples/ravg-lookout/x/or4422212214620230806_20221019_20231019_rdnbr_ba4.tif | 398,846 | fc98894ebbc087a2… |
samples/ravg-lookout/x/or4422212214620230806_20221019_20231019_burn_bndy.shp | 127,828 | feae2511528e49ae… |
samples/hja-open/gi00601/x/boundary83.shp | 10,540 | 0774de0a9ebd9693… |
samples/dem3dep/lookout_fire_5070_10m.tif | 15,600,684 | 7d491709f433196d… |
Full checksums are in run.json. Replay refuses an input whose checksum differs.
Method
- Open RAVG's pre-fire (Sentinel-2B, 2022-10-19) and post-fire (Sentinel-2A, 2023-10-19) reflectance images, its dNBR, RdNBR, continuous BA-loss and BA4 rasters, and the burn boundary (EPSG:5070 declared for its non-EPSG Albers .prj, as on R13). All rasters share one 704 × 551 grid of 30 m cells.
- Read the boundary's attributes with gis_query: the assessment type and the dNBR offset, −15, which goes into the RdNBR expression as read.
- Pre-fire NBR with gis_process index (nbr, bands {nir: 4, swir2: 6}), and dNBR with index dnbr on the two images, scale 1000. No reflectance scale is needed: a normalised difference ignores a pure scale factor.
- RdNBR by raster calculation: (dNBR − (−15)) / sqrt(abs(preNBR)), with preNBR unscaled, which is RAVG's sqrt(abs(PreNBR/1000)) with PreNBR × 1000.
- Percent BA loss by the initial-assessment regression: 0 where RdNBR/1.144 ≤ 166.5, 100 past the curve's peak (RdNBR/1.144 ≥ 166.5 + 389·π/2), and 100·sin²((RdNBR/1.144 − 166.5)/389) between.
- Differences against RAVG, cell by cell: |ours − RAVG| for dNBR (RAVG's −32768 fill left out) and for RdNBR (ours truncated to an integer, as RAVG stores it), and for BA loss over RAVG's footprint (BA4 codes 1–4; its −9999 unmappable cells left out), each binned with reclassify, whose cellsPerRule gives the counts. As a diagnostic, RdNBR again from RAVG's integer dNBR and our pre-fire NBR.
- BA4 classes from our RdNBR by reclassify, with the class edges solved from the regression: more than 0% loss above RdNBR 190.48 (166.5 × 1.144), 25% at 423.49 and 75% at 656.50.
- Cross-tabulate against RAVG's BA4 (code = ours × 10 + RAVG) over the whole grid and over the cells whose centre lies inside the burn boundary; count each code with reclassify.
- RAVG's summary-table classes (0–25 / 25–50 / 50–75 / 75–100% loss) from our continuous BA loss, inside the boundary, in acres.
- Render our classes and the cells whose class differs from RAVG's, at 2400 px, over a hillshade of the 10 m 3DEP DEM, with the burn boundary and the HJ Andrews boundary.
The run made 49 NativeGIS calls: gis_open × 9, gis_query × 1, gis_process × 27, gis_close × 8, gis_render × 4.
Published numbers next to ours
Each step against RAVG's product, cell by cell
| Quantity | Cells compared | |diff| ≤ 0.5 (or identical) | ≤ 1 | ≤ 2 | > 2 | Largest |
|---|---|---|---|---|---|---|
| dNBR × 1000 (continuous, ours unrounded) | 355,776 | 270,739 76.10% | 85,037 23.90% | 0 0.00% | 0 0.00% | 0.998 |
| RdNBR (ours truncated; first column = identical) | 355,757 | 222,804 62.63% | 131,203 36.88% | 1,378 0.39% | 372 0.10% | 381 |
| Diagnostic: RdNBR from RAVG's integer dNBR and our pre-fire NBR | 355,757 | 339,769 95.51% | 15,722 4.42% | 93 0.03% | 173 0.05% | 392 |
| Basal-area loss (percentage points), RAVG's footprint | 117,334 | 117,329 100.00% | 2 0.00% | 2 0.00% | 1 0.00% | 2.68 |
Each bin column holds the cells in that bin alone (the RdNBR rows: identical, 1, 2, more than 2 apart). Cumulative: dNBR 76.1% / 100.0% / 100.0% / 100.0%; RdNBR 62.6% / 99.5% / 99.9% / 100.0%. Steps: pre-fire NBR [9], dNBR [10], RdNBR [11] with the offset read at [8], BA loss [12]; differences and bins [13, 14, 15, 16, 19, 20, 21]. Where RdNBR differs by more than 2, the pre-fire NBR is at most 0.23 [17]; over the image it averages 0.76. Units: dNBR and RdNBR are unitless (× 1000 as RAVG stores them); BA loss in percent. n as given per row, 30 m cells.
Loss classes: ours against RAVG's BA4
| Our class \ RAVG's class | 1: 0% | 2: >0 to <25% | 3: 25 to <75% | 4: 75 to 100% | Our share | RAVG share |
|---|---|---|---|---|---|---|
| 1: 0% | 63,512 | 90 | 0 | 0 | 54.2% | 54.1% |
| 2: >0 to <25% | 1 | 22,895 | 7 | 0 | 19.5% | 19.6% |
| 3: 25 to <75% | 0 | 26 | 13,880 | 3 | 11.9% | 11.8% |
| 4: 75 to 100% | 0 | 0 | 16 | 16,904 | 14.4% | 14.4% |
| Same class | 117,191 of 117,334 cells | 99.88% | ||||
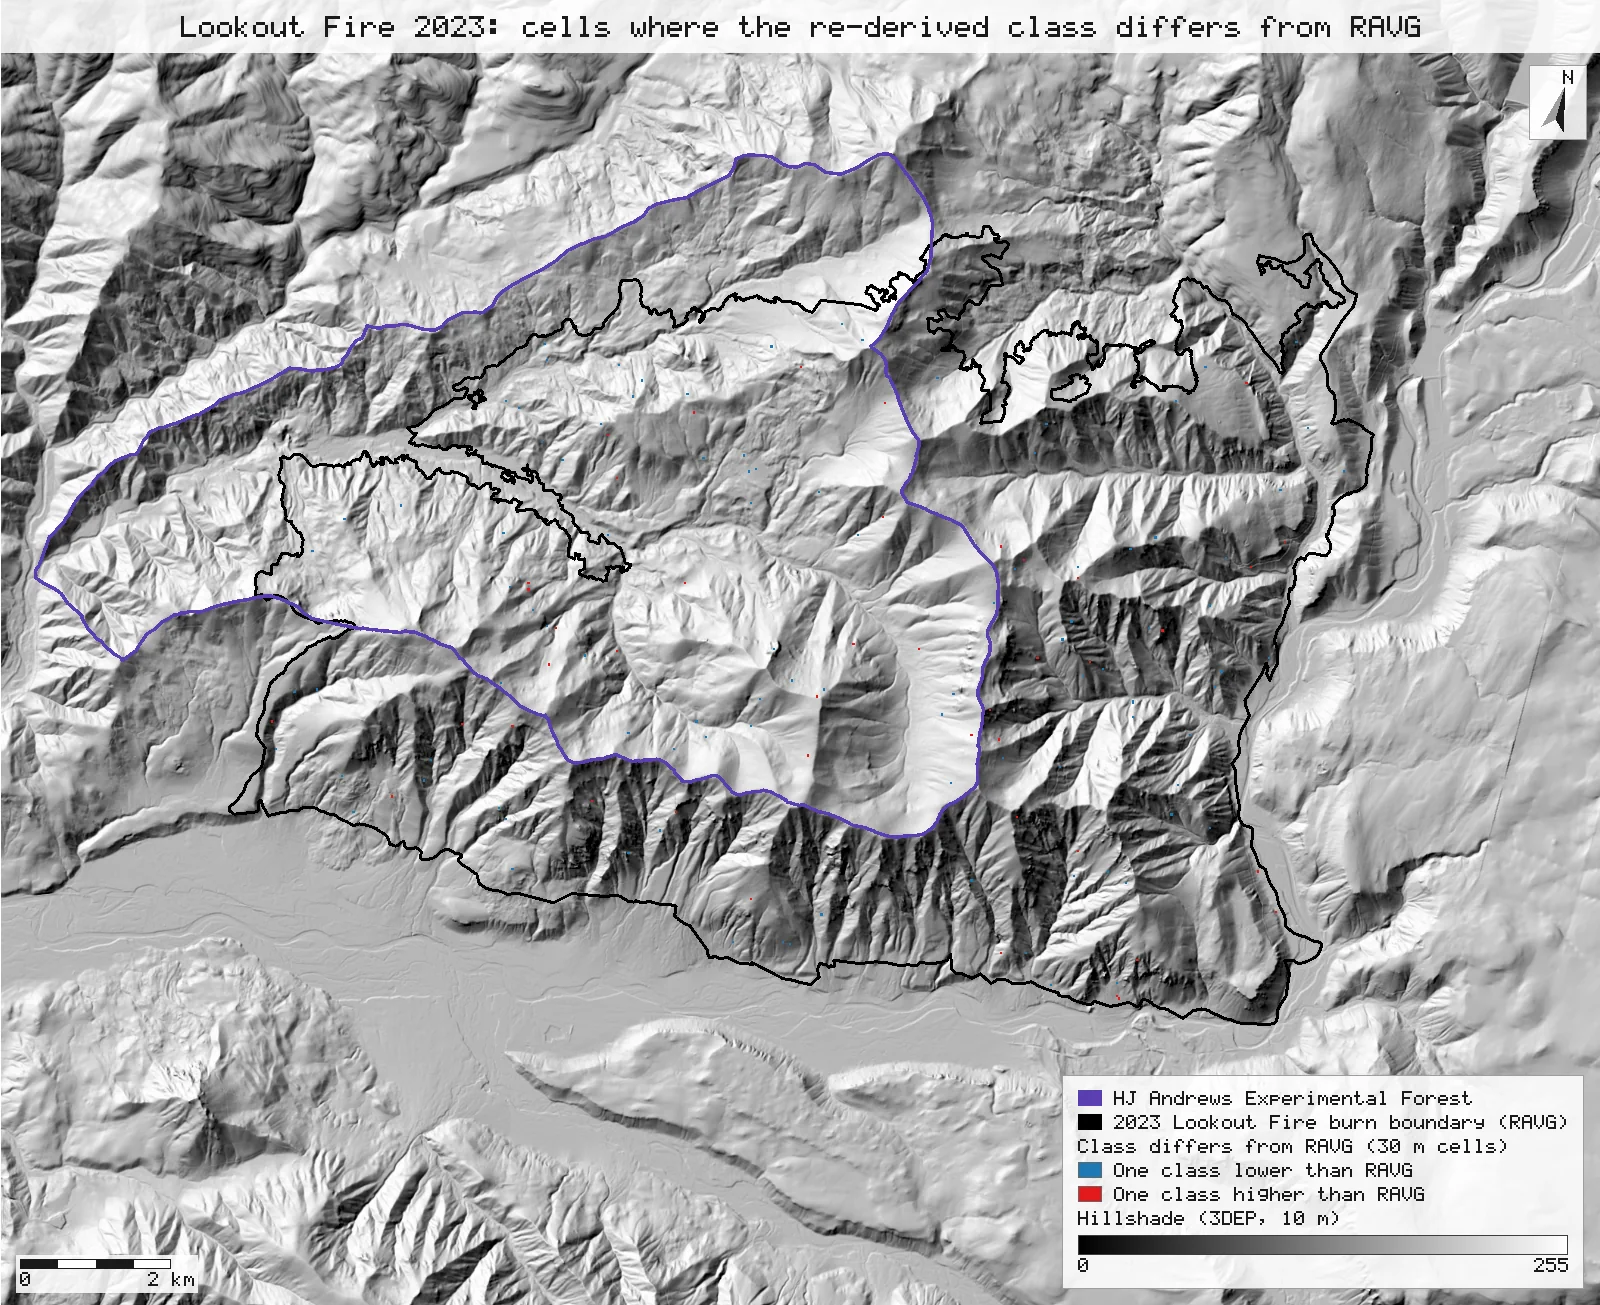
Method: our RdNBR in four classes at RdNBR 190.48, 423.49, 656.50 [27]; code = ours × 10 + RAVG [28], counted by reclassify [29]. Footprint: RAVG's BA4 codes 1–4, n = 117,334 cells (its 4 unmappable cells left out). Inside the burn boundary (cell centres) [30, 32]: 115,600 of 115,743 cells agree (99.88%); shares ours 53.6 / 19.7 / 12.0 / 14.6% against RAVG's 53.6 / 19.8 / 12.0 / 14.6%. Every differing cell is one class away.
RAVG's summary table, from our continuous loss
| BA loss | Ours (ac) | RAVG table (ac) | Difference |
|---|---|---|---|
| 0–25% | 18,888 | 18,887 | +0.00% |
| 25–50% | 1,632 | 1,623 | +0.53% |
| 50–75% | 1,460 | 1,467 | −0.52% |
| 75–100% | 3,762 | 3,761 | +0.05% |
| Total | 25,742 | 25,739 |
Method: our BA loss clipped to the burn boundary (cell centres) [35] and counted in [0, 25), [25, 50), [50, 75), [75, 100] [36]; acres = cells × 900 m² / 4046.8564. "RAVG Table (BA)" in or4422212214620230806_20221019_20231019_ravg_tables.xlsx, summed over vegetation groups and ownership: acres with 0–25, 25–50, 50–75 and 75–100% basal-area loss; its total includes 0.89 ac unmappable. n = 115,748 cells.
Why any numbers differ
- dNBR agrees to within one unit everywhere, but only 76.1% of cells to within half a unit. RAVG computed its dNBR from reflectance before rescaling it to integers for the download, so NBR from the downloaded integers differs slightly in every cell. All 355,776 cells with a RAVG value are within ±1 (the largest difference is 0.998).
- RdNBR: 62.6% identical, 99.5% within ±1, 99.9% within ±2. The remaining 372 cells are where the pre-fire NBR is close to zero (at most 0.23 there, against a mean of 0.76 over the image): RdNBR divides by its square root, which magnifies the small dNBR differences. Rebuilding RdNBR from RAVG's own integer dNBR, with our pre-fire NBR, makes 95.5% identical, so most of the remaining difference comes from dNBR and little from the formula.
- Basal-area loss: within 0.5 percentage points in 117,329 of 117,334 cells over RAVG's footprint; the largest difference is 2.7 points. The regression, its 1.144 initial-assessment adjustment and the 0 and 100% limits give RAVG's continuous BA product.
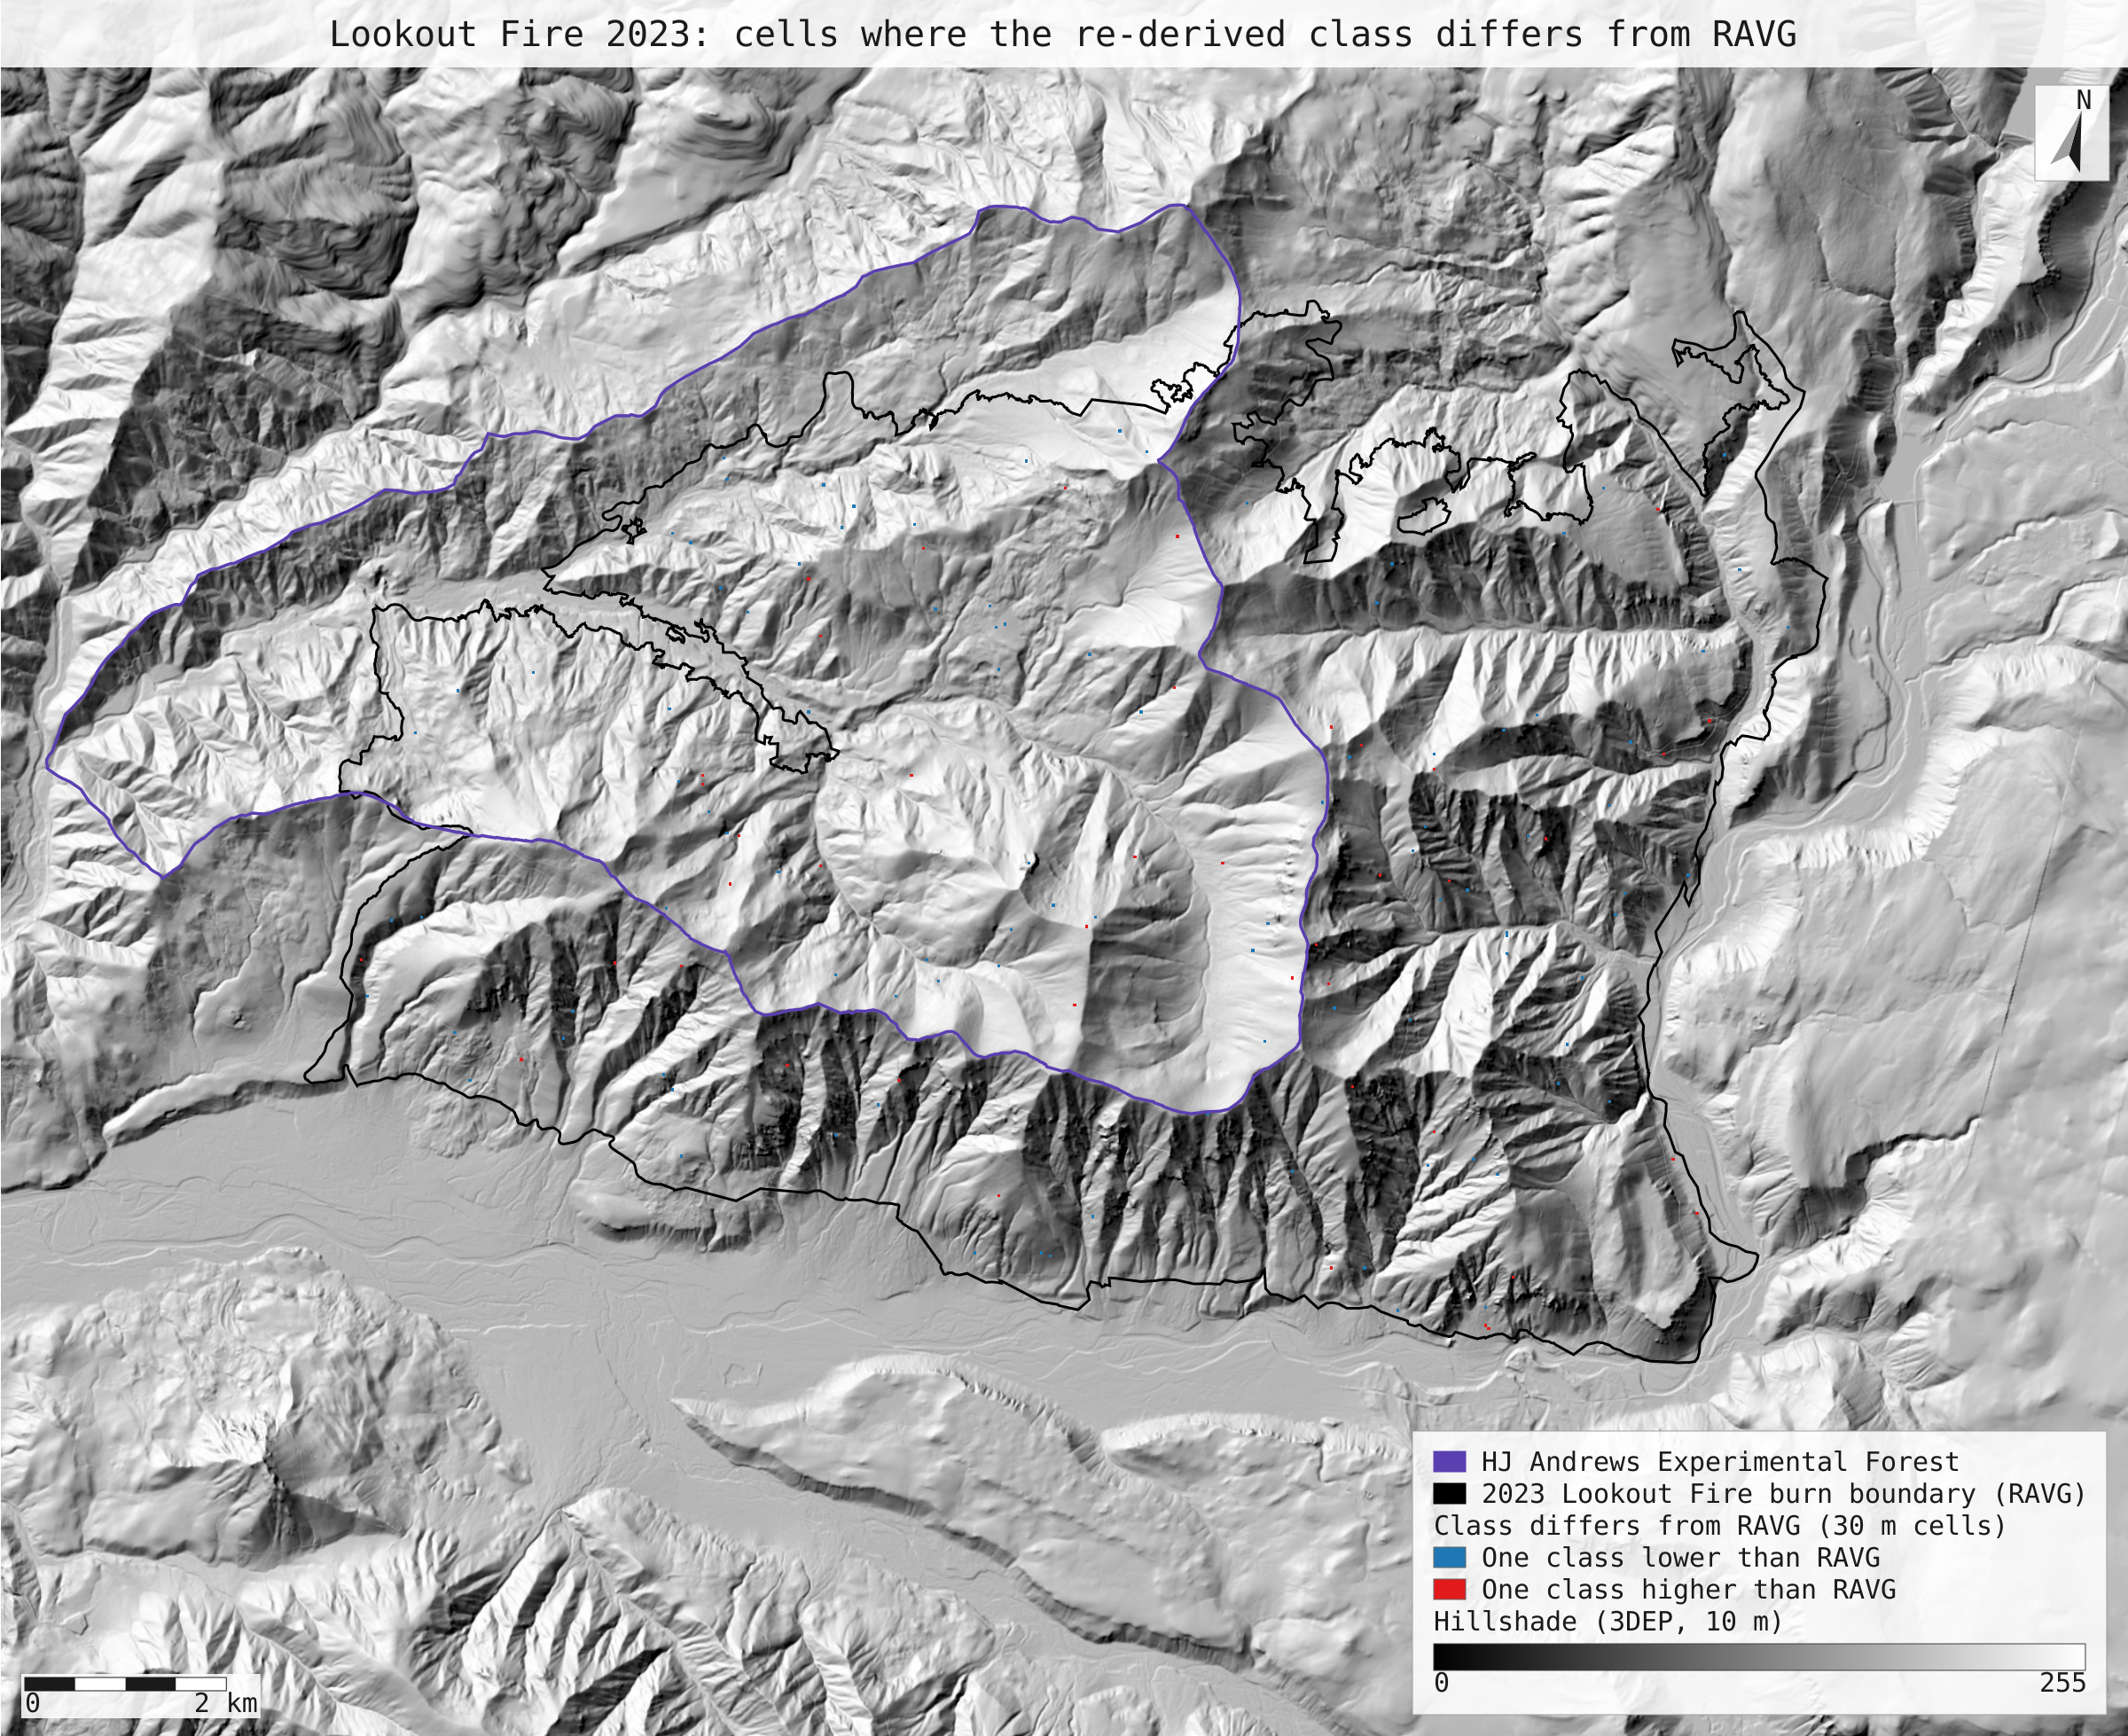
- Classes: 143 cells differ, all by one class. 99.88% of the footprint is in the same BA4 class as RAVG's, and 99.88% inside the burn boundary. Of the 143, 90 sit on the 0% / under-25% edge (ours 0%, RAVG's above 0), where an RdNBR within ±1 of RAVG's decides the class. The maps show they are scattered single cells, not a region.
- Shares and RAVG's table. Over RAVG's footprint our classes give 54.2 / 19.5 / 11.9 / 14.4% against RAVG's 54.1 / 19.6 / 11.8 / 14.4%. In the summary table's classes, inside the boundary, our acres are within 0.6% of RAVG's in every class.
Replay it yourself
The run file records every call, its arguments, the checksums of the files it read and the numbers it returned. Replaying it repeats every call in a fresh NativeGIS session and checks that each answer comes out the same.
- Make an empty data folder and fetch the inputs into it exactly as below (bash; the folder layout is the one the run file expects):
cd /path/to/an/empty/folder
mkdir -p samples/ravg-lookout && curl -fL -o samples/ravg-lookout/or4422212214620230806_20221019_20231019_ravg_data.zip https://edcintl.cr.usgs.gov/downloads/sciweb1/shared/MTBS_Fire/data/ravg/data/or4422212214620230806_20221019_20231019_ravg_data.zip && unzip -o samples/ravg-lookout/or4422212214620230806_20221019_20231019_ravg_data.zip -d samples/ravg-lookout/x
mkdir -p samples/hja-open/gi00601 && curl -fL -o samples/hja-open/gi00601/gi00601.zip https://andrewsforest.oregonstate.edu/sites/default/files/lter/data/studies/spatialdata/gi00601.zip && unzip -o samples/hja-open/gi00601/gi00601.zip -d samples/hja-open/gi00601/x
mkdir -p samples/dem3dep && curl -fL -o samples/dem3dep/lookout_fire_5070_10m.tif 'https://elevation.nationalmap.gov/arcgis/rest/services/3DEPElevation/ImageServer/exportImage?bbox=-2066300,2634800,-2045100,2652200&bboxSR=5070&imageSR=5070&size=2120,1740&format=tiff&pixelType=F32&noData=-9999&interpolation=RSP_BilinearInterpolation&compression=None&f=image'
- Download run.json (118,433 bytes, sha256
153d221cc9b23ea1b5acfff4d7d464d892ede4a9040dbb597957b08abecd0fb3). - Ask your assistant to replay it with NativeGIS, or call the tool directly:
gis_replay {"action": "replay",
            "file": "<absolute path to the run.json you downloaded>",
            "inputRoot": "<your data folder>",
            "outputRoot": "<a new, empty folder>"}
Paths in the run file are relative to the data folder (inputRoot), and outputs go under outputRoot, so nothing depends on where the original run lived.
Files
- run.json: the recorded run: every call, its arguments and the numbers it returned
- ba4_differences.svg: map: the 143 cells whose re-derived class differs from RAVG's
Limits
- This checks that RAVG's products follow from its published images and formulas. It does not test the model: the basal-area regression was calibrated on field plots elsewhere (Sierra Nevada and Klamath Mountains), and RAVG notes that parts of this fire had sparse pre-fire tree cover, terrain shadow and a small patch of active fire in the post-fire image.
- The downloadable reflectance is a rescaled integer copy of what RAVG computed from, so exact cell-for-cell identity is not expected. The page reports agreement within ±1 and ±2 units for that reason.
- Only the basal-area regression is applied here; the CBI and canopy-cover regressions are quoted from the metadata but not run.
- The footprint is RAVG's raster as distributed (BA4 codes 1–4, 117,334 cells); four unmappable cells (code 9) are left out of the agreement and the shares.
- NativeGIS gaps this run hit: gis_open has no nodata override, so RAVG's undeclared −32768 and −9999 fills are excluded in each calc expression; the boundary's non-EPSG CRS name had to be declared (NGISB-6); gis_render has no lossy preview format (NGISF-75), so PNG previews are transcoded to WebP outside the run; layers are renamed for the legend with a zero translate (NGISF-72).