Where the Andrews holds its soil: the stable zone, clearcuts and roads
Swanson and Dyrness split the Andrews into a stable zone of 33.4 km² on lava above a contact at 900 to 1,000 m, with only two small road slides from 1950 to 1974, and an unstable zone with 139 slides, where clearcuts lost 6,130 m³/km² to landslides, 2.8 times forest, and road rights of way 30 times. With the 2022-checked open slide inventory, the stable zone is 53.4% of the forest with the contact at 900 m and 44.9% at 1,000 m, against 52.0% published; it holds exactly 2 small road slides at 1,000 m and 5 at 900 m. Over the paper's own areas the clearcut rate comes out 6,356 m³/km² and the road rate 68,669; the forest rate comes out lower, so the ratios to forest come out higher than published.
- Stable zone, share of the forest, contact at 900 m (Table 1: 33.4 of 64.2 km²)52.0% → 53.39% +1.4 ptswithin tolerance
- Stable zone, share of the forest, contact at 1,000 m52.0% → 44.88% −7.1 ptsexplained why
- Road-related slides in the stable zone, 1,000 m2 slides → 2 slides 0match
- Road-related slides in the stable zone, 900 m2 slides → 5 slides +3.0 slides (+150.0%)explained why
- All slides in the stable zone, 1,000 m2 slides → 6 slides +4.0 slides (+200.0%)explained why
- Slides in the unstable zone, 1,000 m139 slides → 134 slides −5.0 slides (−3.6%)explained why
- Clearcut, over the paper's 7.9 km²6,130 m³/km² → 6,356 m³/km² +225.6 m³/km² (+3.7%)within tolerance
- Road right of way, over the paper's 1.5 km²65,470 m³/km² → 68,669 m³/km² +3,198.9 m³/km² (+4.9%)within tolerance
- Forest, over the paper's 21.4 km²2,180 m³/km² → 1,711 m³/km² −468.7 m³/km² (−21.5%)explained why
- Clearcut as a multiple of forest2.8 × → 3.71 × +0.9 × (+32.6%)explained why
- Road right of way as a multiple of forest30 × → 40.1 × +10.1 × (+33.8%)explained why
- Clearcut, over 7.96 km² mapped6,130 m³/km² → 6,311 m³/km² +181.2 m³/km² (+3.0%)within tolerance
- Road right of way, over 1.78 km² mapped65,470 m³/km² → 57,774 m³/km² −7,696.4 m³/km² (−11.8%)explained why
- Forest, over 25.37 km² mapped2,180 m³/km² → 1,444 m³/km² −736.3 m³/km² (−33.8%)explained why
- Clearcut as a multiple of forest2.8 × → 4.37 × +1.6 × (+56.1%)explained why
- Road right of way as a multiple of forest30 × → 40.0 × +10.0 × (+33.4%)explained why
- Management (8% roads, 92% clearcut) as a multiple of forest5 × → 7.2 × +2.2 × (+44.5%)explained why
- Roads' share of management erosion at 8% / 92% ('about equally', read as 50%)50.0% → 44.32% −5.7 ptswithin tolerance
[18, 10, 2]
[48, 60]
[56]
Numbers in brackets, like [14], are step numbers in this study's run.json: the NativeGIS call that returned the figure. NativeGIS 0.3.0, recorded 2026-10-31 15:17 UTC.
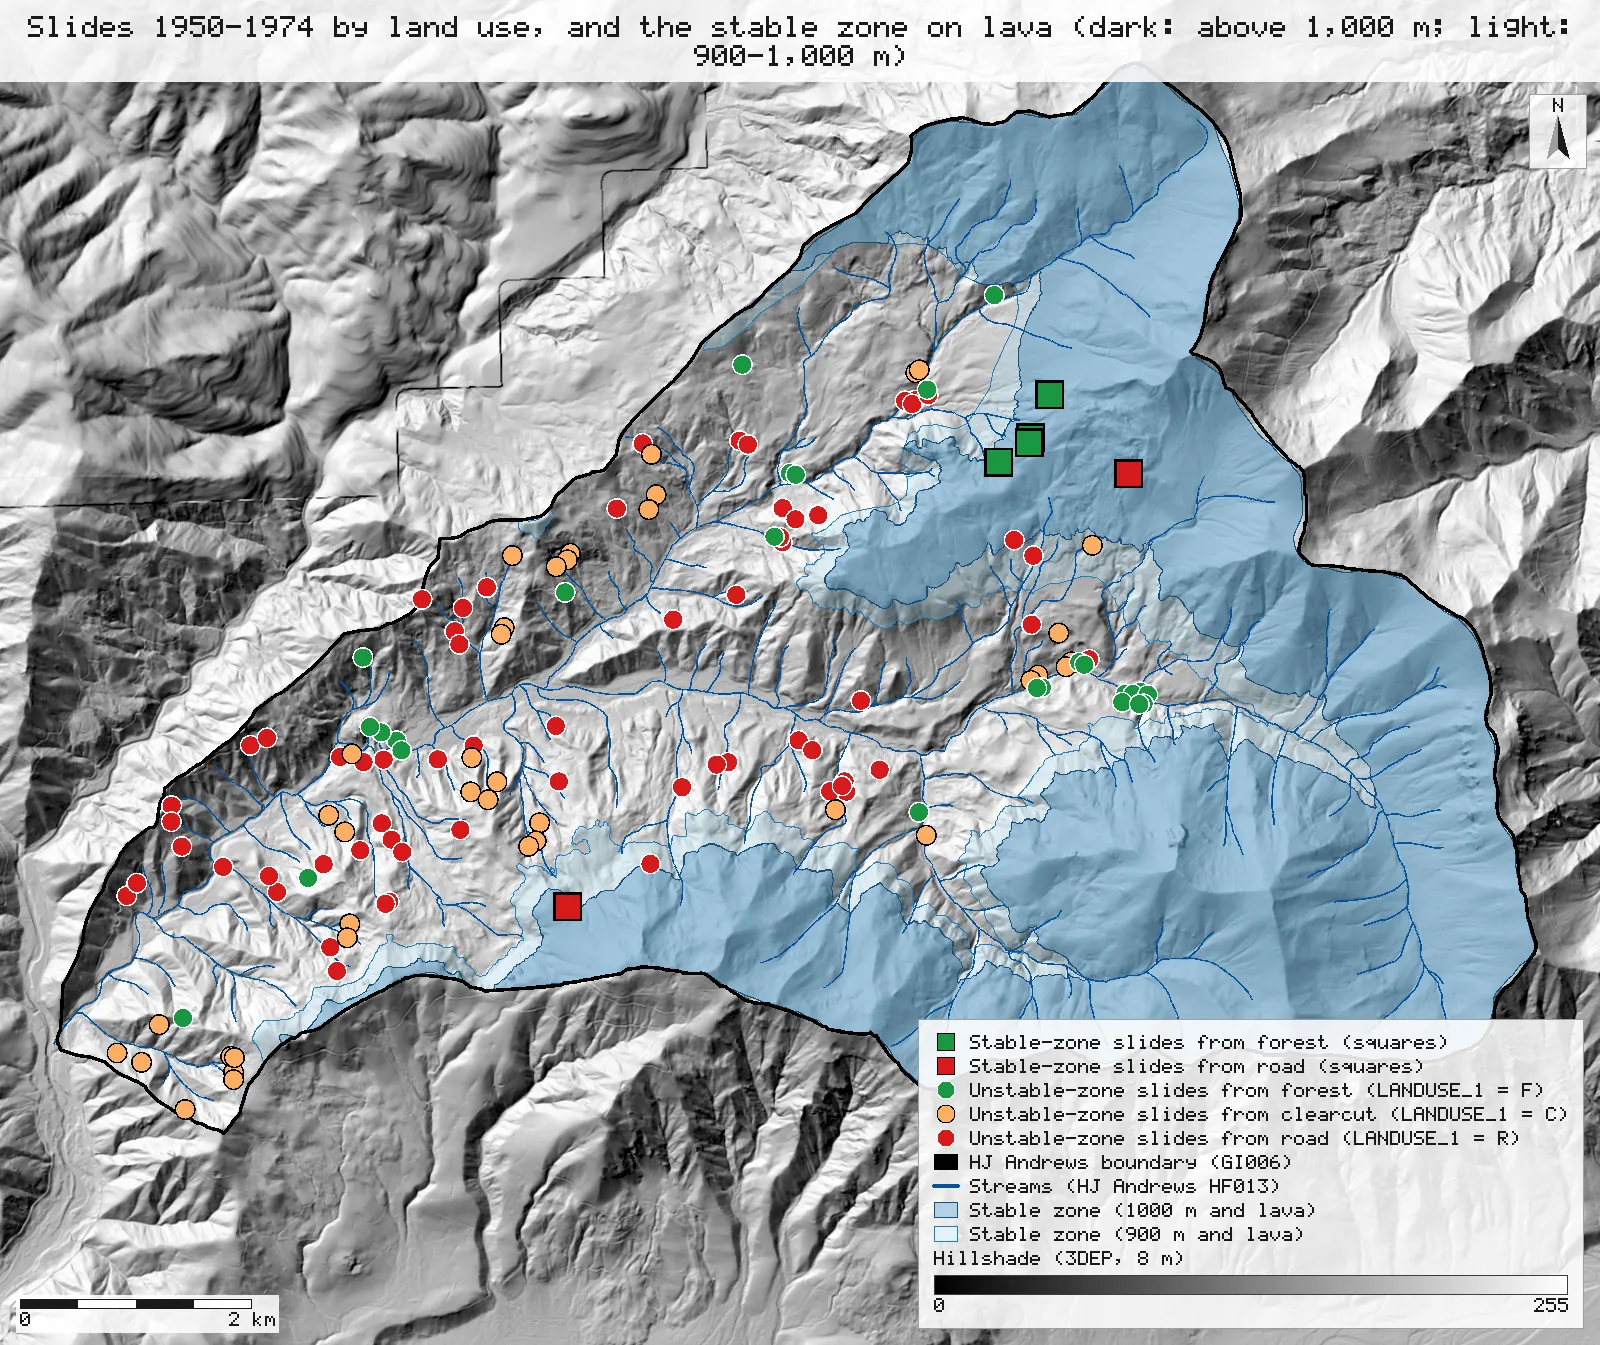
Click or tap a map to open it full screen, then zoom and pan.
What was published
The full text is open on the HJ Andrews site (pub491). Its Table 1 covers 1950–1974. The unstable zone is 30.8 km²: forest 21.4 km² with 32 slide events and 46,600 m³, clearcut 7.9 km² with 36 events and 48,400 m³, and road right of way 1.5 km² with 71 events. That gives 2,180, 6,130 and 65,470 m³/km², or 1.0, 2.8 and 30 times forest. The stable zone is 33.4 km² (forest 28.7, clearcut 4.1, right of way 0.6 km²), so it is 52.0% of the 64.2 km² the table covers; it has no forest or clearcut events, and the text names only two small road-related slides there. The zone line follows the bedrock contact, which the paper places between 900 and 1,000 m. The abstract prints the clearcut rate as 6,030 m³/km², but Table 1 and the text both give 6,130 (48,400 / 7.9): 6,030 is a misprint, and an earlier version of this page quoted it. That version also derived a road rate of 64,600 m³/km² from the abstract (30 × 6,030 / 2.8); the paper prints 65,470. At 8 percent roads and 92 percent clearcut, roads and clearcuts contribute about equally, and management raised slide erosion about 5 times over forest.
Full text (HJ Andrews pub491, PDF) · Abstract (TRID record 40137, open) · Andrews Forest landslide bibliography (citation) · Journal article (GSA)
Published method. Slides were compiled from Dyrness (1967), Fredriksen's watershed observations, air photos of 1946, 1951, 1955, 1959, 1967 and 1972, storm memos, interviews and field checks; each slide's volume came from its measured scar and its date from those sources and tree rings. Logging and road history came from Willamette National Forest timber-sale records; where the right-of-way area was not given, it was estimated from road length at an assumed width of 20 m. The zone line follows the bedrock contact mapped by Swanson & James (1975).
The data and where it came from
All of it is open: downloaded without an account or a form.
| Data | Where | Licence |
|---|---|---|
| GE012 Lookout Creek landslide inventory (slide_inv_lookout.shp, NAD83 / UTM 10N), its locations and attributes checked and corrected in 2022: the inventories of Dyrness (INV = D), Swanson (S) and Wallenstein (W), 1953–2014, with YEAR (one year the inventory assigns), YEAR_OR (the original date text), LANDUSE_1 (land use at the origin: R road, C cut, F forest), VOLMETER (volume, m³) and INITELEV (field-recorded start elevation, feet) | HJ Andrews LTER, 457 kB zip, no form or account https://andrewsforest.oregonstate.edu/sites/default/files/lter/data/studies/spatialdata/ge01202.zip | CC BY 4.0 (EDI record for GE012) |
| GE009 geology of the Andrews (geology.shp, NAD83 / UTM 10N); the clastic units Ttc, Tmt and Tu as in R15, every other unit lava | HJ Andrews LTER, 205 kB zip, no form or account https://andrewsforest.oregonstate.edu/sites/default/files/lter/data/studies/spatialdata/ge00901.zip | HJ Andrews data policy (CC BY, acknowledgement requested) |
| GI006 HJ Andrews Experimental Forest boundary (boundary83.shp) | HJ Andrews LTER, zip, no form or account https://andrewsforest.oregonstate.edu/sites/default/files/lter/data/studies/spatialdata/gi00601.zip | HJ Andrews data policy (CC BY, acknowledgement requested) |
| USGS 3DEP elevation, exported as an 8 m DEM (32-bit float GeoTIFF, NAD83 UTM zone 10N): the 900 m and 1,000 m zone lines, the elevation under each slide as a cross-check, and the maps' hillshade | USGS National Map 3DEP elevation image service (exportImage), no form or account https://elevation.nationalmap.gov/arcgis/rest/services/3DEPElevation/ImageServer | US federal data, public domain |
| Harvest sites: historical harvest units with the year of the overstory cut (OVRSTRY_YR). Land cover / land use service, layer 0, as GeoJSON in EPSG:4326 | Oregon State University / HJ Andrews open-data hub, anonymous REST query, fetched 2026-10-30 https://services1.arcgis.com/CD5mKowwN6nIaqd8/arcgis/rest/services/HJ_Andrews_LCLU__2018/FeatureServer/0 | HJ Andrews data policy (CC BY, acknowledgement requested) |
| HJA roads: the Andrews road network as re-digitised from the 2008 LiDAR DEM, with no construction dates. Base layers service, layer 6, as GeoJSON in EPSG:4326 | Oregon State University / HJ Andrews open-data hub, anonymous REST query, fetched 2026-10-30 https://services1.arcgis.com/CD5mKowwN6nIaqd8/arcgis/rest/services/HJ_Andrews_Base_GIS_Layers__2018/FeatureServer/6 | HJ Andrews data policy (CC BY, acknowledgement requested) |
| HJ Andrews stream network (HF013, hydro.shp), NAD83 UTM zone 10N; drawn on the maps only | HJ Andrews LTER, zip, no form or account https://andrewsforest.oregonstate.edu/sites/default/files/lter/data/studies/spatialdata/hf01301.zip | HJ Andrews data policy (CC BY, acknowledgement requested) |
The input files the run read, pinned by checksum
| File (relative to the data folder) | Bytes | sha256 |
|---|---|---|
samples/hja-open/gi00601/x/boundary83.shp | 10,540 | 0774de0a9ebd9693… |
samples/hja-open/ge00901/x/geology.shp | 31,040 | 8380a806b8970f0f… |
samples/dem3dep/lookout_creek_26910_8m.tif | 11,930,186 | de869b30bf1a2161… |
samples/hja-open/ge01202/x/slide_inv_lookout.shp | 5,224 | 46175d3f25916f8b… |
samples/goodman-2023/hub/harvest_sites.geojson | 635,270 | abfe5b7ef269f51d… |
samples/goodman-2023/hub/roads.geojson | 727,664 | 6c913bf70d2c68df… |
samples/hja-open/hf01301/x/hydro.shp | 173,308 | 263271acd998f7bd… |
Full checksums are in run.json. Replay refuses an input whose checksum differs.
Method
- Zones as areas. Reclassify the 8 m DEM to the land at or above 1,000 m, polygonize it, clip it to the Andrews boundary and then to the GE009 lava units: that is the stable zone, and the unstable zone is the rest of the forest. Do the same at 900 m. The paper puts the contact between 900 and 1,000 m, so both lines are reported side by side.
- Slides. Clip the GE012 Lookout Creek points to the boundary and keep YEAR 1950–1974 (every original date text, YEAR_OR, of those slides lies wholly inside the period). Give each slide the rock unit under it (spatialJoin within GE009) and the DEM elevation under it. A slide is in the stable zone when its field-recorded start elevation (INITELEV, feet) is at or above the line (3,281 ft for 1,000 m, 2,953 ft for 900 m) and it is on lava; the DEM elevation is the cross-check. List each zone's slides by LANDUSE_1 with their volumes (VOLMETER); the page sums them.
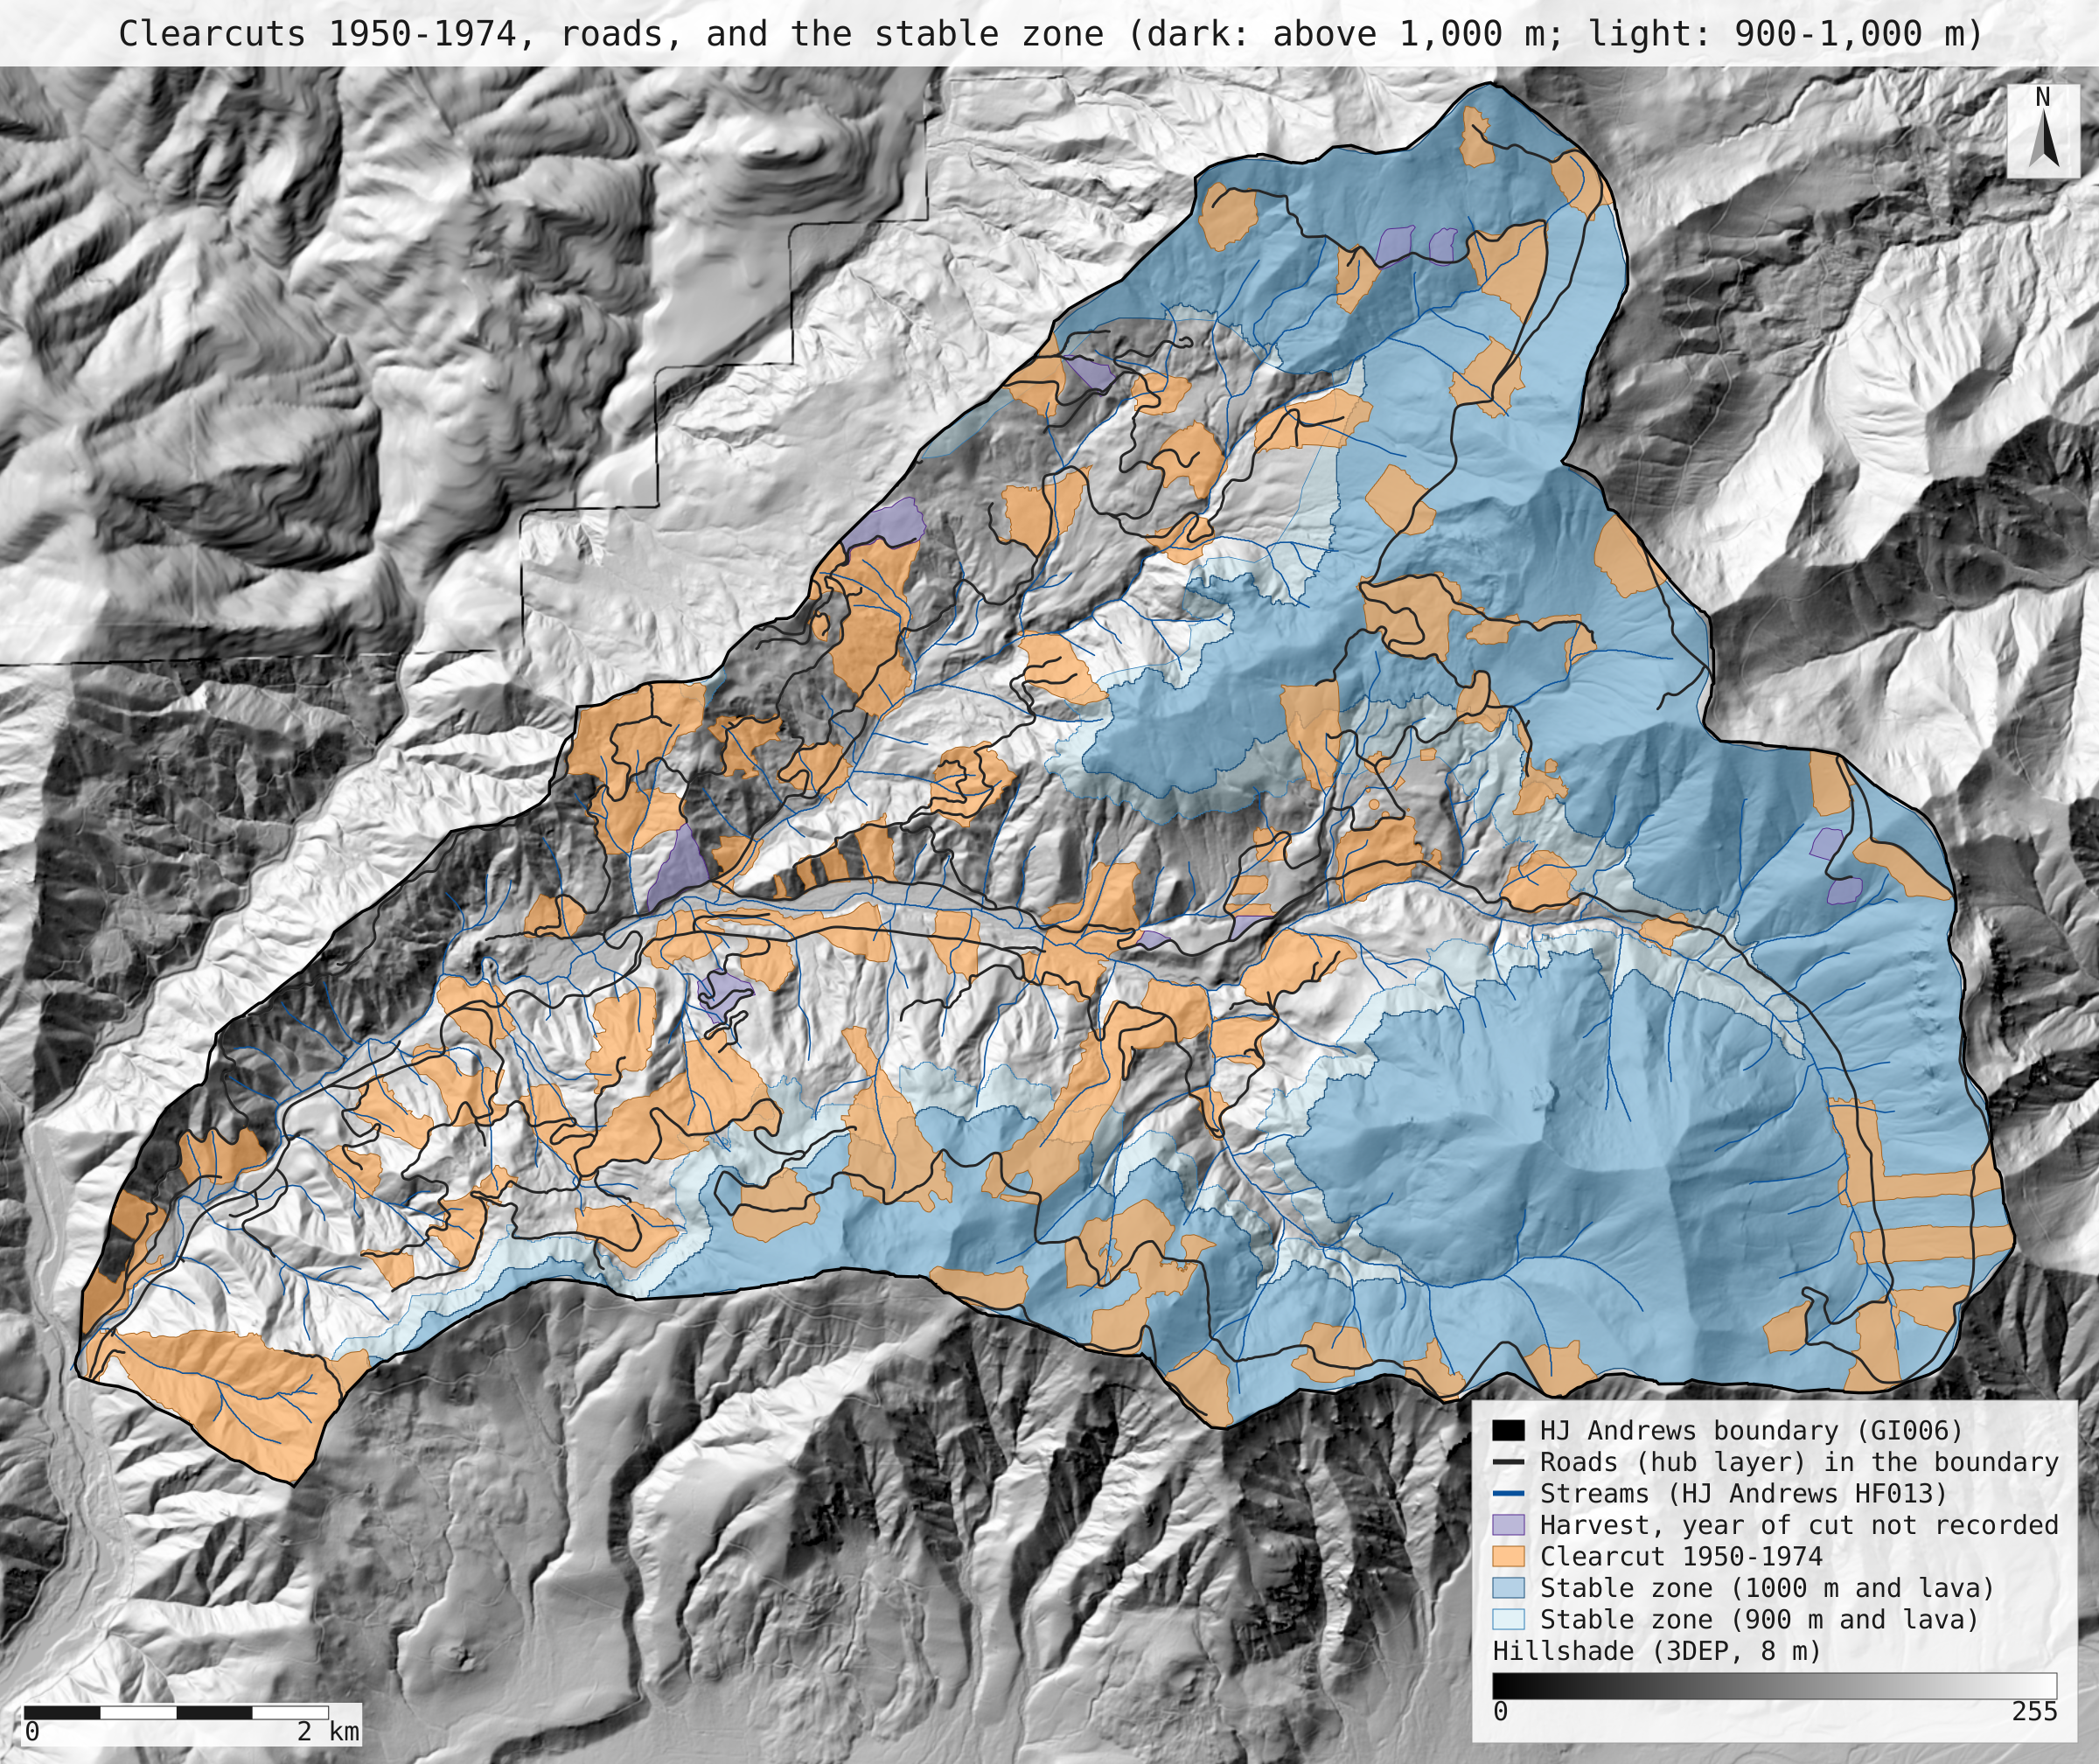
- Land use by 1974 in the unstable zone, at each line: the hub harvest units with OVRSTRY_YR 1950–1974 (dissolved, so overlapping units count once), the road right of way as every hub road buffered 10 m each side (the paper's 20 m width), clearcut taken outside the right of way, and forest as the rest.
- Rates, two ways: each land use's slide volume over the paper's own Table 1 area (which tests only the slide volumes and counts), and over the area mapped here (the independent version).
- Render two maps as SVG over a hillshade of the DEM with the stable zone shaded at both lines; record the run and replay it in a fresh session.
The run made 120 NativeGIS calls: gis_open × 7, gis_process × 48, gis_query × 51, gis_close × 10, gis_render × 4.
Published numbers next to ours
The two zones and their slides, with the contact at 1,000 m and at 900 m
The paper puts the contact "between 900 and 1,000 m"; both lines are shown, and neither is chosen for its fit.
| Measure | Published | NativeGIS, 1,000 m | NativeGIS, 900 m | How NativeGIS got it |
|---|---|---|---|---|
| Stable zone (above the line on lava), share of the forest | 52.0% 33.4 km² of 64.2 km² | 44.9% 28.59 km² | 53.4% 34.01 km² | DEM at or above the line, polygonized and clipped to the boundary (63.69 km²) [9, 17, 2], then to the GE009 lava units [5, 10, 18]; the unstable zone is the rest [11, 19]. At 1,000 m the stable zone is 5 separate pieces, the largest 28.44 km² [24, 25] |
| Slides 1950–1974 in the stable zone | 2, both small and road-related | 6 road 2, clearcut 0, forest 4 | 10 road 5, clearcut 1, forest 4 | Field-recorded start elevation INITELEV (feet) at or above the line and the rock unit under the point on lava (spatialJoin within GE009) [37, 46, 58], listed by land use [48, 50, 52, 60, 62, 64]. At 1,000 m the road slides are 76 and 153 m³ and the forest slides start at 3,500–3,600 ft. By the DEM elevation under the point instead: 7 at 1,000 m [47], 10 at 900 m [59]. Slides at or above 1,000 m on the clastic units: 0 [70] |
| Slides 1950–1974 in the unstable zone | 139 road 71, clearcut 36, forest 32 | 134 road 69, clearcut 39, forest 26 | 130 road 66, clearcut 38, forest 26 | 140 slides of GE012 slide_inv_lookout with YEAR 1950–1974 inside the boundary [32] (Dyrness 44 [33], Swanson 96 [34]; all land uses: road 71, clearcut 39, forest 30 [43, 44, 45]), less the stable ones: below the line or on a clastic unit [54, 66]. 4 slides have INITELEV 0 (not recorded) and count as unstable; none of them is at or above 1,000 m on the DEM [36] |
Rates with the paper's areas: tests the slide volumes and counts only
| Land use | Published | NativeGIS, 1,000 m | NativeGIS, 900 m | How NativeGIS got it |
|---|---|---|---|---|
| Clearcut | 6,130 m³/km² 2.8 × forest | 6,356 m³/km² 3.71 × forest | 6,065 m³/km² 3.54 × forest | 39 slides, 50,209 m³ at 1,000 m [56]; 38, 47,915 m³ at 900 m [68]; over the paper's 7.9 km² (Table 1) |
| Road right of way | 65,470 m³/km² 30 × forest | 68,669 m³/km² 40.1 × forest | 68,057 m³/km² 39.8 × forest | 69 slides, 103,003 m³ at 1,000 m [55]; 66, 102,086 m³ at 900 m [67]; over the paper's 1.5 km² (Table 1) |
| Forest | 2,180 m³/km² | 1,711 m³/km² | 1,711 m³/km² | 26 slides, 36,622 m³ at 1,000 m [57]; 26, 36,622 m³ at 900 m [69]; over the paper's 21.4 km² (Table 1) |
| Management at 8% roads, 92% clearcut, relative to forest | about 5 × | 6.6 × | 6.4 × | 0.08 × road ratio + 0.92 × clearcut ratio |
| Roads' share of that management erosion | about equal | 48.4% | 49.4% | 0.08 × road rate against 0.92 × clearcut rate |
Rates with areas mapped here, 20 m right of way: the independent version
| Land use | Published | NativeGIS, 1,000 m | NativeGIS, 900 m | How NativeGIS got it |
|---|---|---|---|---|
| Clearcut | 6,130 m³/km² 2.8 × forest | 6,311 m³/km² 4.37 × forest | 6,516 m³/km² 3.68 × forest | 39 slides, 50,209 m³ at 1,000 m [56]; 38, 47,915 m³ at 900 m [68]; over 7.96 km² at 1,000 m [100] and 7.35 km² at 900 m [109] (paper 7.9 km²) |
| Road right of way | 65,470 m³/km² 30 × forest | 57,774 m³/km² 40.0 × forest | 61,182 m³/km² 34.5 × forest | 69 slides, 103,003 m³ at 1,000 m [55]; 66, 102,086 m³ at 900 m [67]; over 1.78 km² at 1,000 m [97] and 1.67 km² at 900 m [106] (paper 1.5 km²) |
| Forest | 2,180 m³/km² | 1,444 m³/km² | 1,772 m³/km² | 26 slides, 36,622 m³ at 1,000 m [57]; 26, 36,622 m³ at 900 m [69]; over 25.37 km² at 1,000 m [104] and 20.67 km² at 900 m [113] (paper 21.4 km²) |
| Management at 8% roads, 92% clearcut, relative to forest | about 5 × | 7.2 × | 6.1 × | 0.08 × road ratio + 0.92 × clearcut ratio |
| Roads' share of that management erosion | about equal | 44.3% | 44.9% | 0.08 × road rate against 0.92 × clearcut rate |
Units: m³ from GE012 VOLMETER, m² in NAD83 / UTM zone 10N (EPSG:26910), reported as km². Slides are zoned by their field start elevation; areas by the DEM. Clearcut is the hub harvest units cut 1950–1974 (120 units [86]) outside the right of way; the right of way is every hub road buffered 10 m each side, the paper's 20 m width; forest is the rest of the unstable zone. Units with no recorded year cover 0.38 km² of the unstable zone [102] and count as forest. In the 1,000 m stable zone by 1974: 4.30 km² of clearcut [115] and 0.69 km² of right of way [116] (paper 4.1 km² and 0.6 km²). 183 GE012 points of all years lie in the forest [27].
Why any numbers differ
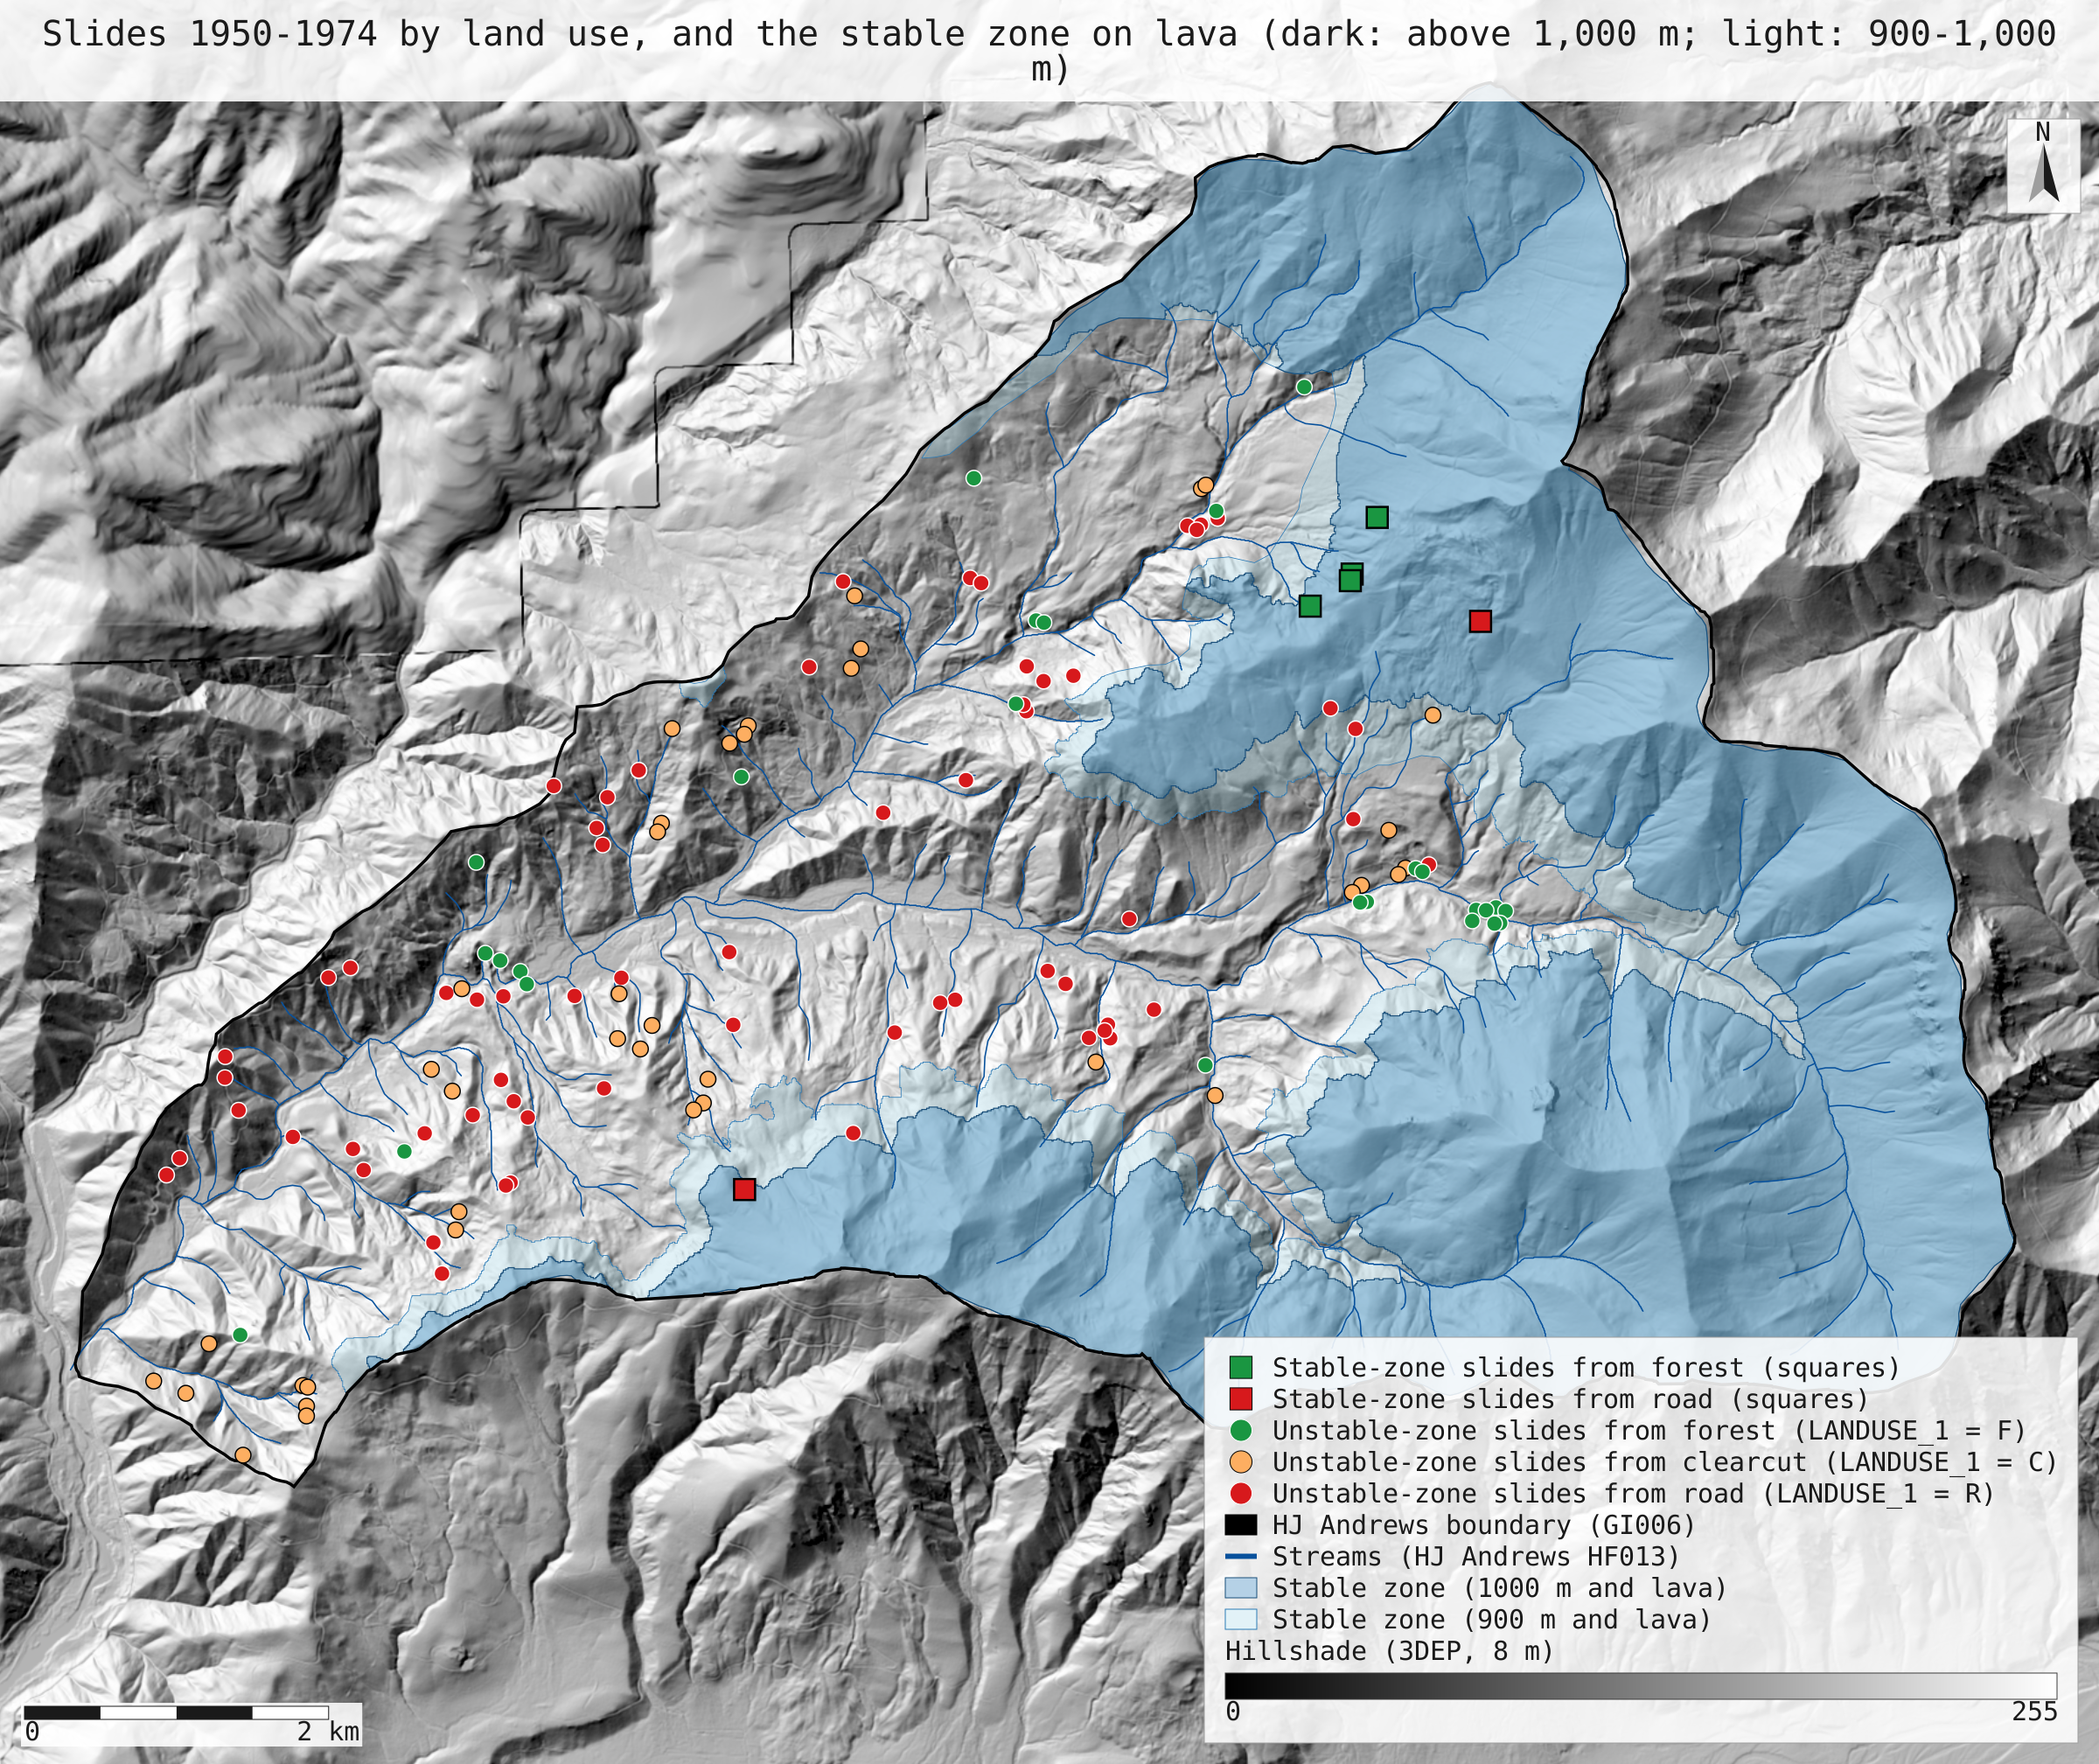
- Which zone line fits depends on what is compared, so both are shown. With the contact at 900 m the stable zone is 53.4% of the forest, against 52.0% in Table 1; at 1,000 m it is 44.9%. Almost all the land above 1,000 m is lava (98.7%), so the elevation line does most of the work. The slide counts point the other way: by the field-recorded start elevation, the stable zone holds exactly 2 road slides at 1,000 m (76 and 153 m³, both small, as published) but 5 road slides and 1 clearcut slide at 900 m. The 1,000 m line is used for the rates below, and the 900 m results sit next to them in every table.
- Four forest slides sit on lava above 1,000 m, where Table 1 has none. They start at 3,500 to 3,600 ft by the field record and lie on lava on the open geology map, so this page places them in the stable zone (6 stable-zone slides at 1,000 m in all, against 2). Table 1 has no forest events in the stable zone, so the authors, who drew the contact from their own field mapping, evidently counted these in the unstable zone. The open map is a 1991 compilation, not the authors' mapping. By the DEM elevation instead of the field one, the stable zone holds 7 slides at 1,000 m (3 of them from roads) and 10 at 900 m.
- The unstable zone has slightly fewer slides. 134 of the 140 slides of 1950–1974 (44 from Dyrness, 96 from Swanson) fall in it at 1,000 m, against 139: 69 from roads, 39 from clearcuts and 26 from forest, against 71, 36 and 32. At 900 m it holds 130. Four slides have no recorded start elevation (INITELEV 0) and count as unstable; none of them is at or above 1,000 m on the DEM.
- With the paper's areas, the clearcut and road rates come out close. Clearcut slides in the unstable zone total 50,209 m³: over the paper's 7.9 km² that is 6,356 m³/km², against 6,130 (6,065 at 900 m). Road slides total 103,003 m³: over 1.5 km², 68,669 m³/km², against 65,470 (68,057 at 900 m). This version tests only the slide volumes and counts, since the areas are the paper's.
- The forest rate is the one that differs, and the four high forest slides explain most of it. Forest slides in the unstable zone total 36,622 m³, so over the paper's 21.4 km² the forest rate is 1,711 m³/km² against 2,180, which makes clearcuts 3.7 times forest and roads 40 times (published 2.8 and 30). Counting the four forest slides on lava above 1,000 m in the unstable zone, as Table 1 implies, brings the forest volume to 45,591 m³ (published 46,600), the rate to 2,130 m³/km², and the ratios to 3.0 and 32.
- With areas mapped here, the forest area adds to the gap. At 1,000 m the unstable zone holds 25.37 km² of forest, 7.96 km² of clearcut and 1.78 km² of right of way (paper 21.4, 7.9 and 1.5). The rates are 1,444, 6,311 and 57,774 m³/km², so clearcuts are 4.4 times forest and roads 40 times. At 900 m the areas are 20.67, 7.35 and 1.67 km², the rates 1,772, 6,516 and 61,182 m³/km², and the ratios 3.7 and 35. At 8% roads and 92% clearcut the 1,000 m version gives management 7.2 times forest (published about 5), with roads 44.3% of it: about equal, as published.
- The earlier version of this page explained the gap wrongly. It said the open data could not tell whether the paper counted more forest slides or used a smaller forest area. The full text settles it: against the paper at 1,000 m, our forest area is 1.19 times larger and our forest volume 1.27 times smaller, and the volume gap is almost all the four high forest slides. It also quoted the abstract's misprinted 6,030 as the clearcut rate and a road rate of 64,600 derived from it; both are corrected here to the printed 6,130 and 65,470.
- Not checked: the 8 percent of a typical deforested area that is road right of way. The hub road layer cannot tell the roads built for clearcuts from roads through forest, and carries no dates.
Replay it yourself
The run file records every call, its arguments, the checksums of the files it read and the numbers it returned. Replaying it repeats every call in a fresh NativeGIS session and checks that each answer comes out the same.
- Make an empty data folder and fetch the inputs into it exactly as below (bash; the folder layout is the one the run file expects):
cd /path/to/an/empty/folder
mkdir -p samples/hja-open/ge01202 && curl -fL -o samples/hja-open/ge01202/ge01202.zip https://andrewsforest.oregonstate.edu/sites/default/files/lter/data/studies/spatialdata/ge01202.zip && unzip -o samples/hja-open/ge01202/ge01202.zip -d samples/hja-open/ge01202/x
mkdir -p samples/hja-open/ge00901 && curl -fL -o samples/hja-open/ge00901/ge00901.zip https://andrewsforest.oregonstate.edu/sites/default/files/lter/data/studies/spatialdata/ge00901.zip && unzip -o samples/hja-open/ge00901/ge00901.zip -d samples/hja-open/ge00901/x
mkdir -p samples/hja-open/gi00601 && curl -fL -o samples/hja-open/gi00601/gi00601.zip https://andrewsforest.oregonstate.edu/sites/default/files/lter/data/studies/spatialdata/gi00601.zip && unzip -o samples/hja-open/gi00601/gi00601.zip -d samples/hja-open/gi00601/x
mkdir -p samples/dem3dep && curl -fL -o samples/dem3dep/lookout_creek_26910_8m.tif 'https://elevation.nationalmap.gov/arcgis/rest/services/3DEPElevation/ImageServer/exportImage?bbox=558400,4891600,572400,4904600&bboxSR=26910&imageSR=26910&size=1750,1625&format=tiff&pixelType=F32&noData=-9999&interpolation=RSP_BilinearInterpolation&compression=None&f=image'
mkdir -p samples/goodman-2023/hub && curl -fL -o samples/goodman-2023/hub/harvest_sites.geojson 'https://services1.arcgis.com/CD5mKowwN6nIaqd8/arcgis/rest/services/HJ_Andrews_LCLU__2018/FeatureServer/0/query?where=1%3D1&outFields=*&outSR=4326&f=geojson'
mkdir -p samples/goodman-2023/hub && curl -fL -o samples/goodman-2023/hub/roads.geojson 'https://services1.arcgis.com/CD5mKowwN6nIaqd8/arcgis/rest/services/HJ_Andrews_Base_GIS_Layers__2018/FeatureServer/6/query?where=1%3D1&outFields=*&outSR=4326&f=geojson'
mkdir -p samples/hja-open/hf01301 && curl -fL -o samples/hja-open/hf01301/hf01301.zip https://andrewsforest.oregonstate.edu/sites/default/files/lter/data/studies/spatialdata/hf01301.zip && unzip -o samples/hja-open/hf01301/hf01301.zip -d samples/hja-open/hf01301/x
- Download run.json (224,685 bytes, sha256
3c6c1164b09abafe28fa612a20424a56d6d188e312de69ee1a937b2faf040516). - Ask your assistant to replay it with NativeGIS, or call the tool directly:
gis_replay {"action": "replay",
            "file": "<absolute path to the run.json you downloaded>",
            "inputRoot": "<your data folder>",
            "outputRoot": "<a new, empty folder>"}
Paths in the run file are relative to the data folder (inputRoot), and outputs go under outputRoot, so nothing depends on where the original run lived.
Files
- run.json: the recorded run: every call, its arguments and the numbers it returned
- slides_by_landuse_stable_zone.svg: the full-detail slide map
- landuse_1974_stable_zone.svg: map: harvest units cut 1950–1974, units with no recorded year, roads and the stable zone at both lines over an 8 m 3DEP hillshade
Limits
- Land use is the state at the end of 1974: harvest units cut in, say, 1973 count with their whole area for the whole period, and the road layer is the 2008 network, so roads built after 1974 count as right of way. The paper's areas are also the state at the end of its period.
- 10 harvest units have no year of cut (OVRSTRY_YR = 0); the 0.38 km² of them in the unstable zone counts as forest here.
- The inventory points were screen-digitised from field maps, so each is a location to within tens of metres; the rock unit is read at the point. Volumes are the inventory's VOLMETER, converted from the field estimates in cubic yards.
- YEAR in the 2022 inventory is one year per slide, assigned by the inventory from ranges such as "64-65"; every 1950–1974 slide's original range lies inside the period, so the choice of year does not move a slide in or out.
- Slides are zoned by their field start elevation, but the zone areas come from the DEM, because the field record has no area. The two agree on all but one road slide at 1,000 m.
- Areas are in UTM zone 10N, not an equal-area projection; at the Andrews the UTM scale error is under 0.1%.