The HJ Andrews LiDAR stem map, benchmarked
The published file holds exactly the 1,328,242 trees it reports. On one 750 m tile of the same flight, NativeGIS finds the tall trees the stem map finds, to within a few tenths of a metre of height. Where the two disagree is the 10 to 20 m trees.
- Trees ≥ 10 m in the published file1,328,242 → 1,328,242 0match
- Detection agreement on one tile (F-score, smoothing off)0.83benchmark
- Height bias against the stem map (smoothing off)−0.2 mbenchmark
[1]
[17, 14]
[17]
Numbers in brackets, like [14], are step numbers in this study's run.json: the NativeGIS call that returned the figure. NativeGIS 0.3.0, recorded 2026-10-31 05:18 UTC.
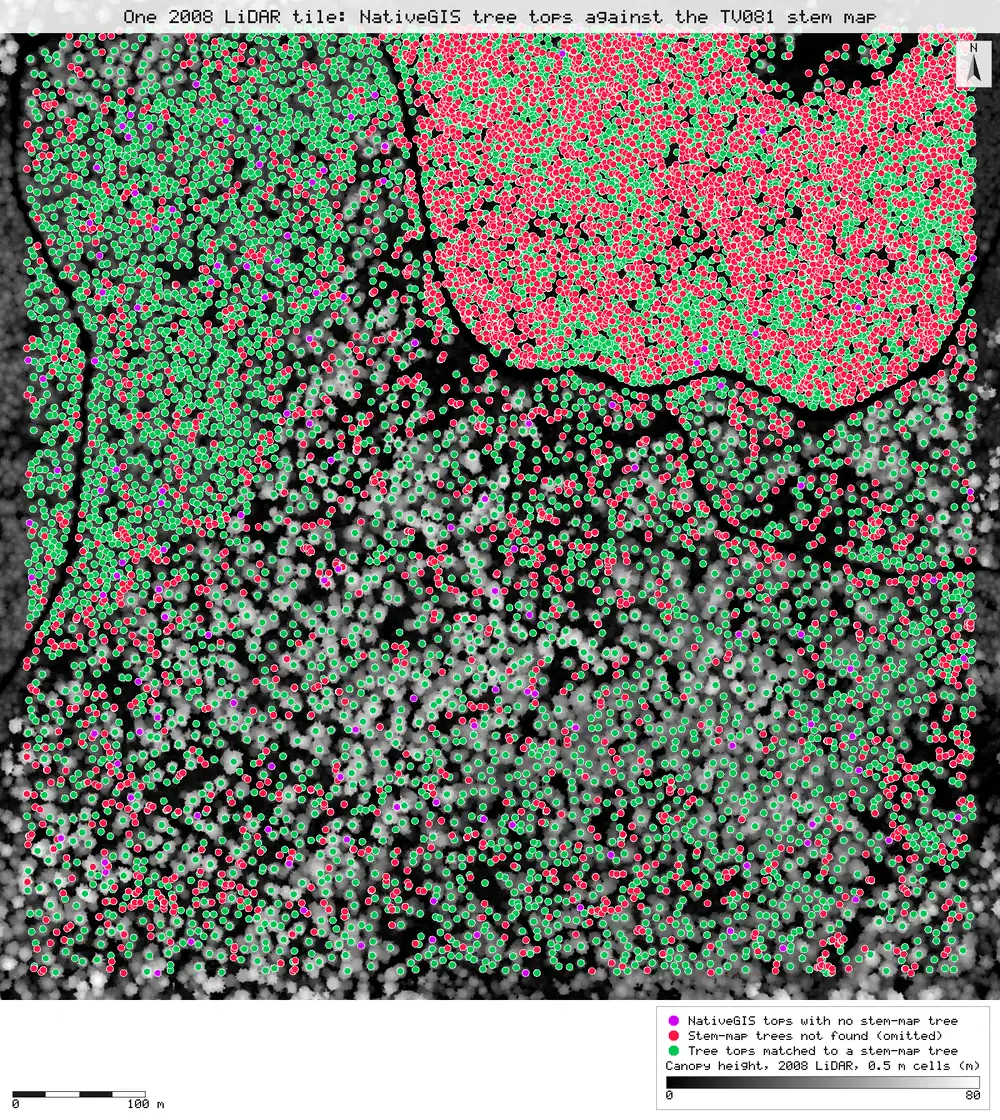
Click or tap a map to open it full screen, then zoom and pan.
What was published
A stem map of every tree 10 m or taller across the 2008 HJ Andrews LiDAR area, each with a position, height and crown radius.
TV081 stem map metadata · HJ Andrews data catalogue
Published method. From the metadata: a 0.5 m canopy height model made with FUSION's CanopyModel, then the TreeVaW variable-window local-maximum detector with windows between 3 and 23 m. Window size comes from height-to-crown equations from the literature for 10 to 60 m trees, and a self-fitted relationship above that. Trees under 10 m are left out.
The data and where it came from
All of it is open: downloaded without an account or a form.
| Data | Where | Licence |
|---|---|---|
| The published stem map, tv08117.zip: stem_map.shp, NAD83 UTM zone 10N | HJ Andrews LTER, 37.2 MB zip (sha256 98f5f73b…494b02), downloaded without a form https://andrewsforest.oregonstate.edu/sites/default/files/lter/data/studies/spatialdata/tv08117.zip | Use constraints "no legal constraints", acknowledgement requested; the HJ Andrews data policy is CC BY and asks users to identify themselves |
| The same 2008 LiDAR flight (Watershed Sciences, 10–11 Aug 2008), tile ot_HJ_Andrews_bin_100.laz: 750 × 750 m, E 565350–566100, N 4900150–4900900, EPSG:26910 | OpenTopography OTLAS.082011.26910.1, anonymous bulk download https://portal.opentopography.org/lidarDataset?opentopoID=OTLAS.082011.26910.1 | Treated as CC BY 4.0 with attribution to HJ Andrews / Watershed Sciences (HJ Andrews catalogue GI010); OpenTopography lists the licence as not provided |
The input files the run read, pinned by checksum
| File (relative to the data folder) | Bytes | sha256 |
|---|---|---|
samples/tv081/x/stem_map.shp | 37,190,876 | 82fe0b31a73b5008… |
samples/ot2008/ot_HJ_Andrews_bin_100.laz | 27,093,103 | bf81fa07ed8a166e… |
work/repro/tv081-stems-prev/chm_2008_0p5m.tif | 10,709,057 | 857566541e312f29… |
Full checksums are in run.json. Replay refuses an input whose checksum differs.
Method
- Open the published stem map and count its trees. Open the LAZ tile (reprojected on read to EPSG:26910) and run LiDAR QA on it.
- Select the reference trees inside the tile.
- Ground: keep the ground classification delivered with the flight (0.35 ground points per m², above the 0.25 auto threshold). Build a 1 m DTM, then a 0.5 m pit-free canopy height model, the same cell size as the stem map's.
- Detect trees with gis_lidar_trees, NativeGIS's variable-window local-maximum detector (the same family as the published method). Settings: minimum height 10 m, minimum window 3 m (the published lower bound), the default Pacific Northwest crown equation, and Gaussian CHM smoothing σ = 1 cell (the default).
- Match against the reference with gis_compare in trees mode: one-to-one optimal (Hungarian) matching within 3 m, scored inside a 20 m inset so trees whose crowns the tile edge cuts don't count.
- One stated sensitivity run, because the published method does not say whether the canopy model was smoothed: detection again with smoothing off (σ = 0), scored the same way. No other setting was changed, and nothing was fitted to the reference.
- Map the default-smoothing comparison: its matched, omitted and committed tree tops, copied under readable names, over the run's 0.5 m canopy height model, as SVG. Write the cited report with gis_report.
The run made 18 NativeGIS calls: gis_open × 3, gis_lidar_qa × 1, gis_query × 1, gis_lidar_ground × 1, gis_lidar_dtm × 1, gis_lidar_chm × 1, gis_lidar_trees × 2, gis_compare × 2, gis_process × 4, gis_render × 2.
Published numbers next to ours
The published count
The published file holds 1,328,242 tree records [1], the number the dataset reports. That count is confirmed from the file, not regenerated: regenerating it needs all 189 tiles of the flight.
One tile, matched tree by tree
| Default smoothing (σ = 1) [14] | Smoothing off (σ = 0) [17] | |
|---|---|---|
| Stem-map trees in the scored inset (reference) | 14,997 | 14,997 |
| NativeGIS trees in the inset | 9,188 | 11,462 |
| Matched one-to-one | 9,054 | 11,033 |
| Recall (share of reference trees matched) | 60.4% | 73.6% |
| Precision (share of NativeGIS trees matched) | 98.5% | 96.3% |
| F-score | 0.749 | 0.834 |
| Height bias, NativeGIS − stem map (m) | −0.43 | −0.18 |
| Height RMSE (m) | 0.91 | 0.74 |
| Mean position offset (m) | 0.48 | 0.52 |
Method: gis_compare trees mode, one-to-one Hungarian matching within 3 m, scored inside a 20 m inset of the tile (E 565,370–566,080, N 4,900,170–4,900,880, 50.4 ha). Units: metres, EPSG:26910; heights above ground. n = 14,997 reference trees ≥ 10 m in the inset (16,624 in the whole tile [5]). The tile holds 5,493,081 points, 9.77 per m², 0.35 ground points per m² [4].
By reference tree height, smoothing off
| Height class | Stem-map trees | Not matched | Height bias (m) |
|---|---|---|---|
| 10–20 m | 10,195 | 34.2% | −0.11 |
| 20–30 m | 1,795 | 15.0% | −0.22 |
| 30–40 m | 1,436 | 7.5% | −0.24 |
| 40–50 m | 580 | 9.0% | −0.38 |
| 50–60 m | 344 | 7.6% | −0.43 |
| 60–70 m | 522 | 4.2% | −0.34 |
| 70+ m | 125 | 1.6% | −0.40 |
Per-class figures from the smoothing-off comparison [17]; the default run's are in the run file [14] and the cited report.
Why any numbers differ
- Tall trees agree. For trees 30 m and taller, 2 to 9% of reference trees go unmatched, heights agree to within 0.2 to 0.4 m, and positions to about half a metre. Both methods read the same 0.5 m canopy surface from the same points, so this is expected. It is still a check that the canopy model step is equivalent.
- The 10–20 m trees are the difference. They are 68% of the reference trees on this tile, and most of the misses sit in the dense young stand in the north-east quarter (red on the map). In that class the stem map has 1.46 times as many tops as NativeGIS finds, even with smoothing off.
- Nobody can say yet which is nearer the ground truth. No field stem map of this tile is public; the HJ Andrews permanent plots are behind a registration form. More tops is not automatically better: a variable-window detector on a 0.5 m surface can split one crown into several tops.
- Smoothing explains part of the gap, the window equation the rest. Smoothing off raises the match rate by 13 points for a 2-point loss in precision. The stem map used literature crown equations it does not name and capped windows at 23 m. NativeGIS has no window cap and does not yet take a custom crown equation (NGISF-54).
Replay it yourself
The run file records every call, its arguments, the checksums of the files it read and the numbers it returned. Replaying it repeats every call in a fresh NativeGIS session and checks that each answer comes out the same.
- Make an empty data folder and fetch the inputs into it exactly as below (bash; the folder layout is the one the run file expects):
cd /path/to/an/empty/folder
mkdir -p samples/tv081 && curl -fL -o samples/tv081/tv08117.zip https://andrewsforest.oregonstate.edu/sites/default/files/lter/data/studies/spatialdata/tv08117.zip && unzip -o samples/tv081/tv08117.zip -d samples/tv081/x
mkdir -p samples/ot2008 && curl -fL -o samples/ot2008/ot_HJ_Andrews_bin_100.laz https://opentopography.s3.sdsc.edu/pc-bulk/HJAnd_OR/ot_HJ_Andrews_bin_100.laz
- Download run.json (49,133 bytes, sha256
6c2c8eb933b8e51f96ea1f24a112ade328f7ef8758ee58b9ae9bade2e4738f64). - Ask your assistant to replay it with NativeGIS, or call the tool directly:
gis_replay {"action": "replay",
            "file": "<absolute path to the run.json you downloaded>",
            "inputRoot": "<your data folder>",
            "outputRoot": "<a new, empty folder>"}
Paths in the run file are relative to the data folder (inputRoot), and outputs go under outputRoot, so nothing depends on where the original run lived.
Files
- run.json: the recorded run: every call, its arguments and the numbers it returned
- Cited report: written by gis_report: every number links to the call that produced it
- COMPARISON.md: the written comparison, with step citations
Limits
- This is one tile of 189. The forest-wide count is confirmed from the published file, not regenerated: that needs all 4.85 GB of the flight and a tiled run, which exists as a driver script but not yet as a NativeGIS tool (NGISF-33, NGISF-55).
- NativeGIS was not tuned to agree with the stem map. Doing that would turn a benchmark into a fit.
- The published method's software was not run. This compares NativeGIS's detector with the published output on the same data.