Ward et al.'s Lookout Creek river corridor network, derived again from a terrain model and checked against their published geometry
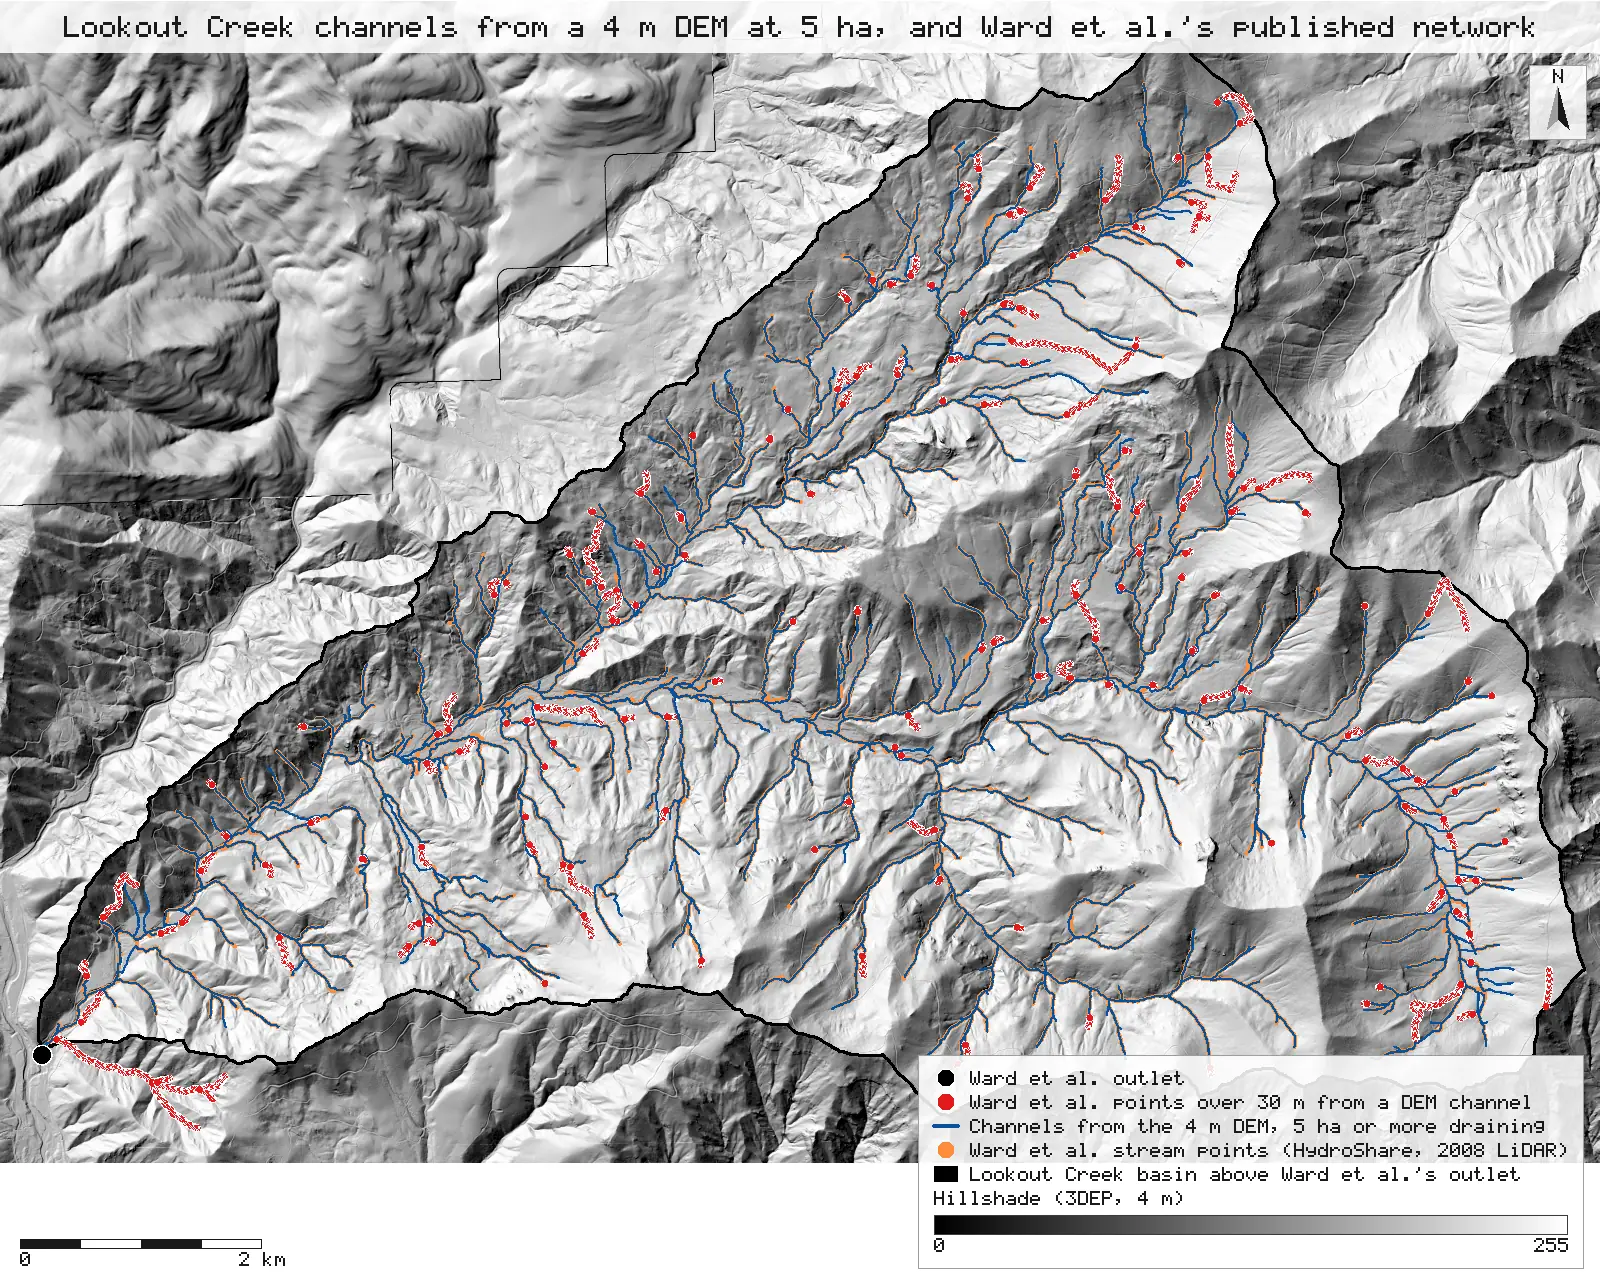
Channels traced from a public 4 m terrain model at Ward et al.'s published 5 ha threshold give 689 links and a 5th-order Lookout Creek, against their 686 segments and 5th order. 90% of their published stream points lie within 30 m of a derived channel, and 99% and more on 3rd to 5th order streams.
- Segments (derived links)686 → 689 +3.0 (+0.4%)within tolerance
- First-order segments344 → 346 +2.0 (+0.6%)within tolerance
- Highest Strahler order5 → 5 0match
- Basin above Ward et al.'s outlet≈ 6,400 ha → 6,264.2 ha −135.8 ha (−2.1%)within tolerance
- Stream length (paper: about 242 km)242 km → 221.9 km −20.1 km (−8.3%)explained why
- Stream centreline length (paper: about 242 km)242 km → 242.0 km 0match
- Ward et al. points within 30 m of a derived channel89.9%new
- Ward et al. points within 10 m83.6%new
- Points on 3rd to 5th order streams within 30 m99.6%new
- Derived channel cells within 30 m of a Ward et al. point92.6%new
- Ward et al. points within 30 m of HF013-0290.9%new
[23, 3]
[33, 36]
[58]
Numbers in brackets, like [14], are step numbers in this study's run.json: the NativeGIS call that returned the figure. NativeGIS 0.4.0, recorded 2026-10-31 22:12 UTC.
The lower basin, close up
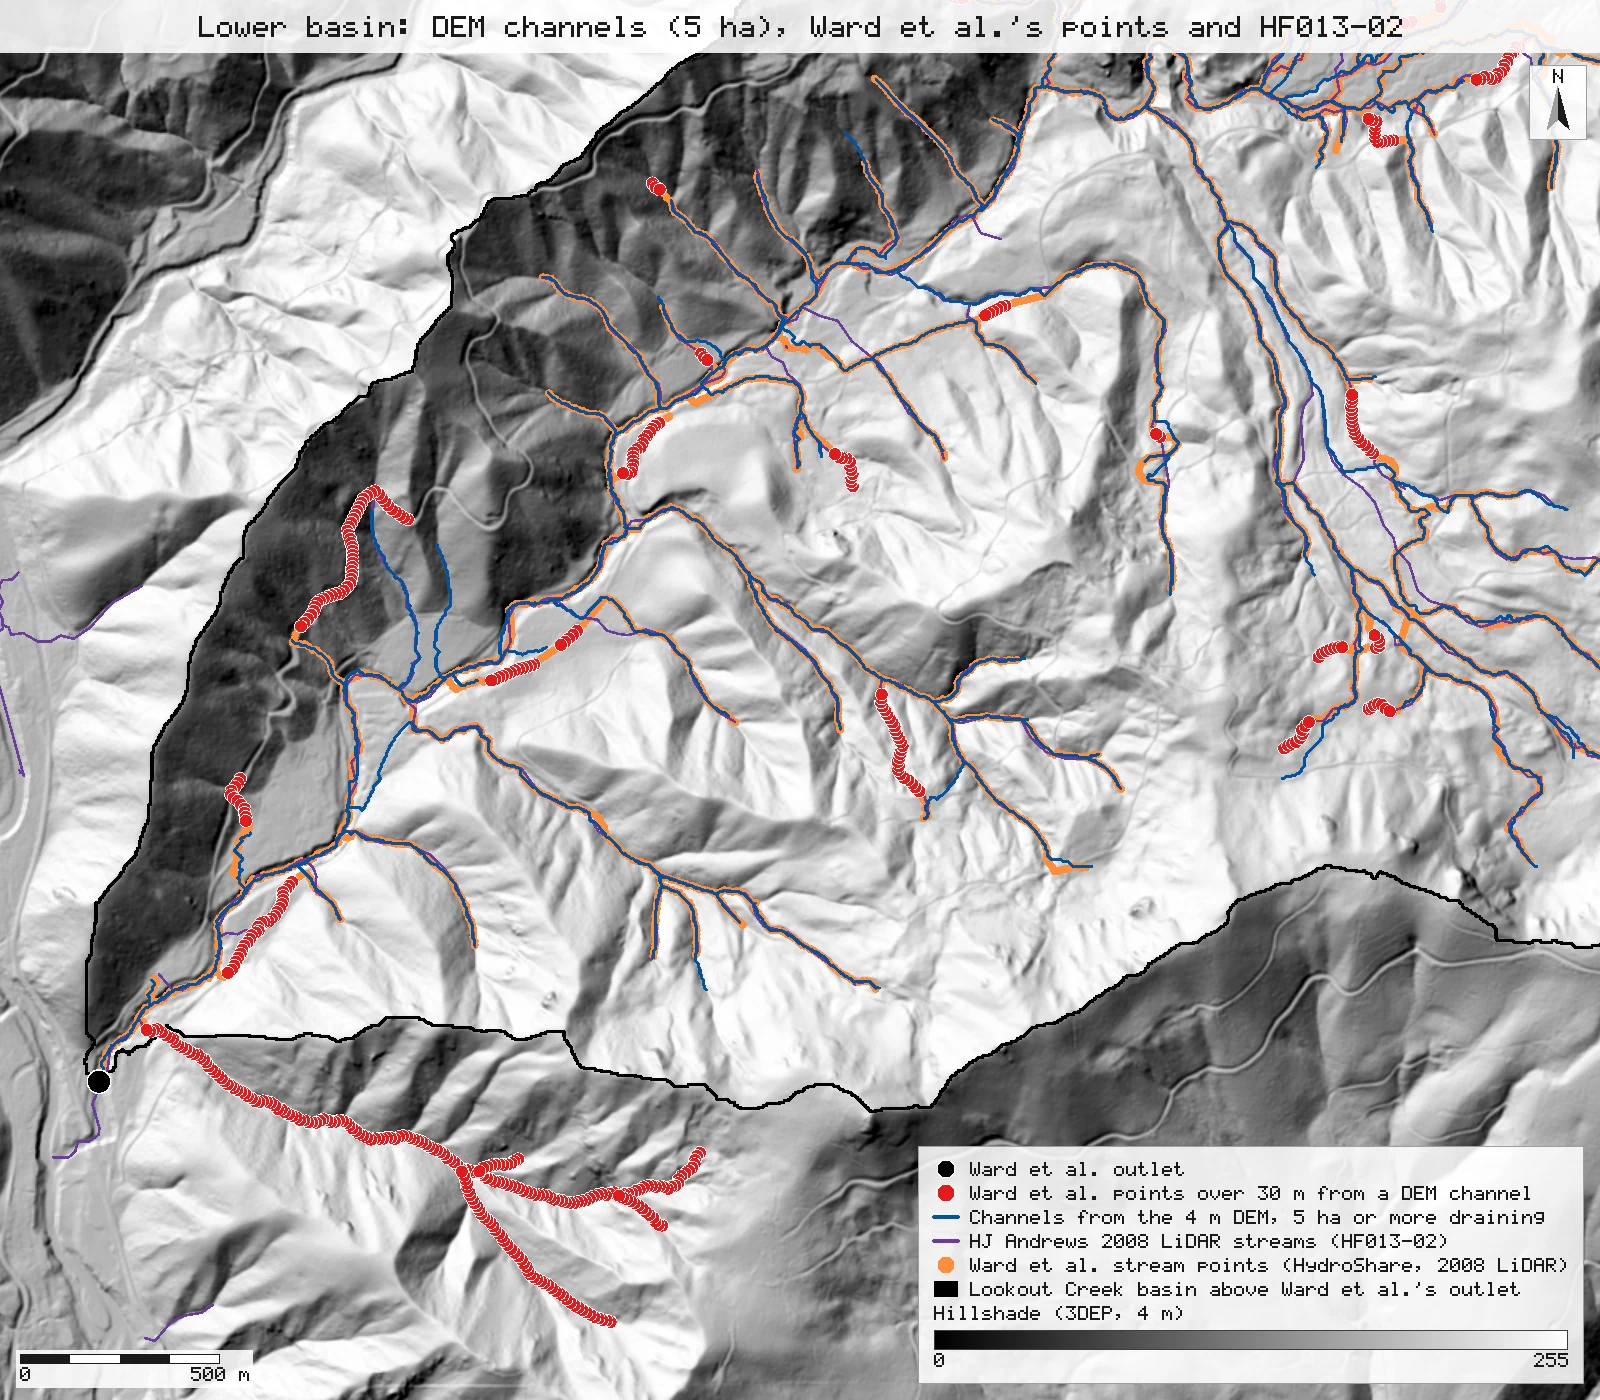
A 4 by 3.5 km window at 1.7 m per pixel: Ward et al.'s points (orange, red beyond 30 m), the derived channels (blue) and HJ Andrews' HF013-02 (purple). The main stem and larger tributaries coincide; the red runs are small channels the two networks trace on different paths, and the tributary below the basin outline that drains past the outlet on the 3DEP DEM.
Click or tap a map to open it full screen, then zoom and pan.
What was published
Ward et al. mapped the river corridor of the whole Lookout Creek network in the HJ Andrews Experimental Forest from "a 1 m digital terrain model based on airborne lidar collected in 2008", with a single-direction flow accumulation algorithm (Seibert and McGlynn, 2007) in a modified open-source topographic analysis toolbox. They "defined the stream network as any location draining more than 5 ha", split it into 686 river corridor segments between junctions, about 209 km of valley holding about 242 km of stream, and describe the basin as 5th order, draining about 6,400 ha. The geometry is published on HydroShare (CC BY 4.0): ValeyDetails.csv (the file's spelling) gives a cross-section about every 10 m of valley, 20,770 in all, each with its stream centreline point, upslope area, Strahler order and segment number. The segment counts below are read from that file.
ESSD paper · HydroShare network geometry · HESS paper · Frontiers in Water paper
Published method. The threshold is published, so it is used as published: channels start where 5 ha or more drains, and nothing on this page is fitted to Ward et al.'s numbers. The terrain model is not the same: theirs is the 2008 1 m LiDAR DEM; this run uses a 4 m export of USGS 3DEP elevation (see Limits).
The data and where it came from
All of it is open: downloaded without an account or a form.
| Data | Where | Licence |
|---|---|---|
| Ward et al. network geometry, ValeyDetails.csv (the file's own spelling): 20,770 cross-sections with stream centreline X/Y/Z, upslope accumulated area, Strahler order and segment number, UTM zone 10N metres | HydroShare resource 19024397586b42b0ae622b5a59b1d919, 10.4 MB CSV, no form or account (the link redirects to the file store) https://doi.org/10.4211/hs.19024397586b42b0ae622b5a59b1d919 | CC BY 4.0 |
| Ward et al. stream centreline, StreamCenterline.csv: 205,322 points along the 1 m stream centreline with X/Y/Z, distance, upslope area, Strahler order and segment number, UTM zone 10N metres (its header ends with a trailing comma, which NativeGIS reads and reports) | Same HydroShare resource, 27.7 MB CSV (sha256 c2b0932f…45b73d70), no form or account https://www.hydroshare.org/resource/19024397586b42b0ae622b5a59b1d919/data/contents/StreamCenterline.csv | CC BY 4.0 |
| USGS 3DEP elevation, exported as a 4 m DEM (32-bit float GeoTIFF, EPSG:26910) over the Lookout Creek basin | USGS National Map 3DEP elevation image service (exportImage), no form or account; the service can answer 502 or 504 under load, and a retry succeeds https://elevation.nationalmap.gov/arcgis/rest/services/3DEPElevation/ImageServer | US federal data, public domain |
| HJ Andrews streams from the 2008 LiDAR DEM (HF013-02, lidar_stream.shp, 1,100 lines) | HJ Andrews LTER, 356 kB zip, no form or account https://andrewsforest.oregonstate.edu/sites/default/files/lter/data/studies/spatialdata/hf01302.zip | HJ Andrews data policy (CC BY, acknowledgement requested) |
The input files the run read, pinned by checksum
| File (relative to the data folder) | Bytes | sha256 |
|---|---|---|
samples/dem3dep/ward_basin_26910_4m.tif | 32,379,914 | 1e3fff6889ad6135… |
samples/ward-hs/ValeyDetails.csv | 10,394,192 | 6b47b82f95d12c98… |
samples/hja-open/hf01302/x/lidar_stream.shp | 160,332 | 70ac82b1e6bf3dc7… |
samples/ward-hs/StreamCenterline.csv | 27,684,522 | c2b0932f8e6e1755… |
Full checksums are in run.json. Replay refuses an input whose checksum differs.
Method
- Open the 4 m 3DEP DEM, Ward et al.'s ValeyDetails.csv as points (the stream centreline X and Y of each cross-section, EPSG:26910) and HJ Andrews HF013-02.
- From the published file alone: group the cross-sections by segment number and order to count segments by order, count cross-sections by order, and take the point with the largest upslope area as Ward et al.'s outlet (gis_process summarize, gis_query).
- Fill depressions (Priority-Flood), D8 flow direction, then the basin above Ward et al.'s outlet (watershed, moving the outlet to the nearest cell within 30 m that drains 100 ha). Keep the flow directions inside the basin only, and check the contributing area at the outlet (flowAccumulation).
- Derive channel links with Strahler order where 5 ha or more drains, the published threshold (streams), and count them by order.
- Distances: for every published stream point, the exact distance to the nearest derived link, simplified to 2 m (spatialJoin nearest), counted within 10 and 30 m and summarised by Ward et al.'s order and by the order of the nearest link. The converse: derived channel cells whose centre lies within 10 or 30 m of a published point (nearest-point interpolation with that search radius as a mask, then zonal counts). The same published points against HF013-02. Which published points fall outside the derived basin (spatialJoin intersects).
- Re-measure the published stream length: open StreamCenterline.csv as points and join them, in file order, into one line per value of "Segment number" (gis_process pointsToLines); the length is the sum of the lines.
- Render the maps as SVG over a hillshade of the same DEM; record the run and replay it in a fresh session.
The run made 56 NativeGIS calls: gis_open × 4, gis_process × 29, gis_query × 19, gis_render × 4.
Published numbers next to ours
Network size, order and basin
| Quantity | Published | NativeGIS | Source |
|---|---|---|---|
| Area draining to Ward et al.'s outlet | 6,335.2 ha (largest UAA in the file) | 6,264.2 ha | watershed on the 4 m DEM, outlet moved 2.4 m [11, 16, 18] |
| Basin, in the paper | about 6,400 ha | 6,264.2 ha | [18] |
| Highest Strahler order | 5 | 5 | streams [23] |
| Segments (links) | 686 | 689 | [3, 23] |
| Stream length | about 242 km | 221.9 km | D8 links joining 4 m cell centres [23] |
| Stream centreline, re-measured | about 242 km | 241.97 km | Ward et al.'s StreamCenterline.csv, 205,322 points joined into 686 lines by segment number [69, 70] |
| Valley length | about 209 km | – | no valley floor is derived here |
Segments and length by order
| Strahler order | Ward et al. segments | Derived links | Ward et al. cross-sections (share) | Derived length, km (share) |
|---|---|---|---|---|
| 1 | 344 | 346 | 11,385 (54.8%) | 120.2 (54.2%) |
| 2 | 167 | 154 | 5,318 (25.6%) | 57.3 (25.8%) |
| 3 | 84 | 92 | 2,089 (10.1%) | 23.3 (10.5%) |
| 4 | 45 | 45 | 942 (4.5%) | 10.0 (4.5%) |
| 5 | 46 | 52 | 1,036 (5.0%) | 11.1 (5.0%) |
| All | 686 [3, 6] | 689 [23, 27] | 20,770 [9] | 221.9 [23] |
Ward et al.'s segments run between junctions, as the derived links do, and carry their own Strahler order; NativeGIS counts them by grouping the cross-sections by segment number and order. Their cross-sections fall about every 10 m of valley, so each order's share of cross-sections is close to its share of valley length. The derived network's smallest channel heads drain 5 ha (3,124 cells of 16 m²); the published file's smallest upslope area is 5.0000 ha [6]. Units: metres and hectares in NAD83 / UTM zone 10N (EPSG:26910).
Where the channels are
| What lies within the distance | Count | Share | Source |
|---|---|---|---|
| Ward et al. cross-section stream points within 10 m of a derived channel | 17,355 of 20,770 | 83.6% | [30, 32] |
| … within 30 m | 18,669 of 20,770 | 89.9% | [33] |
| Derived channel cells within 10 m of a Ward et al. point | 40,375 of 47,135 | 85.7% | [51, 44] |
| … within 30 m | 43,640 of 47,135 | 92.6% | [58] |
| Ward et al. points within 10 m of HJ Andrews HF013-02 | 17,684 of 20,770 | 85.1% | [65, 67] |
| … within 30 m | 18,875 of 20,770 | 90.9% | [68] |
Distances from each published stream point to the nearest derived link (simplified to 2 m, half a cell, which takes out the D8 stair-steps) are exact point-to-line distances (gis_process spatialJoin, nearest). The converse counts derived channel cells whose centre lies within 10 or 30 m of a published point; the points sit about 10 m apart along the valley, so between two points the 30 m test reaches at least 29.6 m.
Distance by order
| Ward et al. order | Points | Within 30 m | Mean distance (m) | Largest (m) |
|---|---|---|---|---|
| 1 | 11,385 | 86.7% | 20.0 | 865.9 |
| 2 | 5,318 | 89.2% | 19.5 | 651.3 |
| 3 | 2,089 | 99.3% | 2.0 | 52.1 |
| 4 | 942 | 99.9% | 1.8 | 32.1 |
| 5 | 1,036 | 99.9% | 2.9 | 31.3 |
Distance to the nearest derived link, by the order Ward et al. give the segment [36, 39]. Of the points within 30 m, 84.8% lie nearest a derived link of the same Strahler order. 227 points (1.1%) lie outside the basin delineated on this DEM [59, 61, 63], 150 of them on one small tributary (segments 519 to 522) south-east of the outlet.
Why any numbers differ
- Network size and order agree. At the published 5 ha threshold the 4 m DEM gives 689 channel links against Ward et al.'s 686 segments, and Lookout Creek is 5th order in both. By order: 346, 154, 92, 45 and 52 links against 344, 167, 84, 45 and 46 segments. First-order channels hold 54.2% of the derived length and 54.8% of the published cross-sections.
- Positions agree on the main channels; they part at small heads. 89.9% of Ward et al.'s 20,770 stream points lie within 30 m of a derived channel and 83.6% within 10 m; 92.6% of the derived channel cells lie within 30 m of a published point (85.7% within 10 m). On 3rd to 5th order streams, 99.3 to 99.9% of the published points are within 30 m, at a mean distance of 1.8 to 2.9 m. The misses are on 1st and 2nd order channels (86.7% and 89.2% within 30 m, mean distance 20.0 and 19.5 m), where a head that one network extends and the other does not, or a small channel that crosses a gentle slope on a different line, leaves points far from any counterpart. Of the points within 30 m, 84.8% lie nearest a derived link of the same order.
- Ward et al.'s network sits as close to HJ Andrews' own 2008 layer. 90.9% of the published points lie within 30 m of HF013-02 and 85.1% within 10 m. Both come from the same 2008 flight, yet they agree with each other about as well as Ward et al.'s points agree with channels traced from a different DEM, which suggests the free choices (initiation threshold, hand edits at culverts, smoothing) move small channels as much as the terrain source does.
- The published centreline measures 241.97 km. Ward et al.'s second file, StreamCenterline.csv, holds their 1 m stream centreline as 205,322 points, each with a segment number. Joined in file order into one line per segment, they make 686 lines, one for each published segment, measuring 241.97 km against the paper's about 242 km. The paper's stream length is therefore re-measured from the published geometry, not only quoted.
- Stream length: 8.3% shorter than published. The derived links measure 221.9 km against the 241.97 km of the published centreline (the paper's about 242 km), and 6.2% more than its about 209 km of valley. The published centreline is traced on a 1 m grid and follows the channel's bends at that scale; D8 links joining 4 m cell centres cut those bends. The difference is a property of grid resolution, not of where the channels are.
- Basin: within 1.1% of the published outlet. The basin above Ward et al.'s outlet measures 6,264.2 ha on the 4 m DEM (outlet moved 2.4 m) against the largest upslope area in their file, 6,335.2 ha, and 2.1% under the paper's rounded 6,400 ha. 227 published points (1.1%) lie outside the derived basin; 150 of them are one small tributary south-east of the outlet that, on the 3DEP DEM, does not drain through the outlet cell.
Replay it yourself
The run file records every call, its arguments, the checksums of the files it read and the numbers it returned. Replaying it repeats every call in a fresh NativeGIS session and checks that each answer comes out the same.
- Make an empty data folder and fetch the inputs into it exactly as below (bash; the folder layout is the one the run file expects):
cd /path/to/an/empty/folder
mkdir -p samples/dem3dep && curl -fL -o samples/dem3dep/ward_basin_26910_4m.tif 'https://elevation.nationalmap.gov/arcgis/rest/services/3DEPElevation/ImageServer/exportImage?bbox=558700,4894200,571900,4903800&bboxSR=26910&imageSR=26910&size=3300,2400&format=tiff&pixelType=F32&noData=-9999&interpolation=RSP_BilinearInterpolation&compression=None&f=image'
mkdir -p samples/ward-hs && curl -fL -o samples/ward-hs/ValeyDetails.csv https://www.hydroshare.org/resource/19024397586b42b0ae622b5a59b1d919/data/contents/ValeyDetails.csv
mkdir -p samples/ward-hs && curl -fL -o samples/ward-hs/StreamCenterline.csv https://www.hydroshare.org/resource/19024397586b42b0ae622b5a59b1d919/data/contents/StreamCenterline.csv
mkdir -p samples/hja-open/hf01302 && curl -fL -o samples/hja-open/hf01302/hf01302.zip https://andrewsforest.oregonstate.edu/sites/default/files/lter/data/studies/spatialdata/hf01302.zip && unzip -o samples/hja-open/hf01302/hf01302.zip -d samples/hja-open/hf01302/x
- Download run.json (157,583 bytes, sha256
f9d5efaa4e2bf2a5040de065d98bb7579875f2461a29c2990867cb46ce1c9bf7). - Ask your assistant to replay it with NativeGIS, or call the tool directly:
gis_replay {"action": "replay",
            "file": "<absolute path to the run.json you downloaded>",
            "inputRoot": "<your data folder>",
            "outputRoot": "<a new, empty folder>"}
Paths in the run file are relative to the data folder (inputRoot), and outputs go under outputRoot, so nothing depends on where the original run lived.
Files
- run.json: the recorded run: every call, its arguments and the numbers it returned
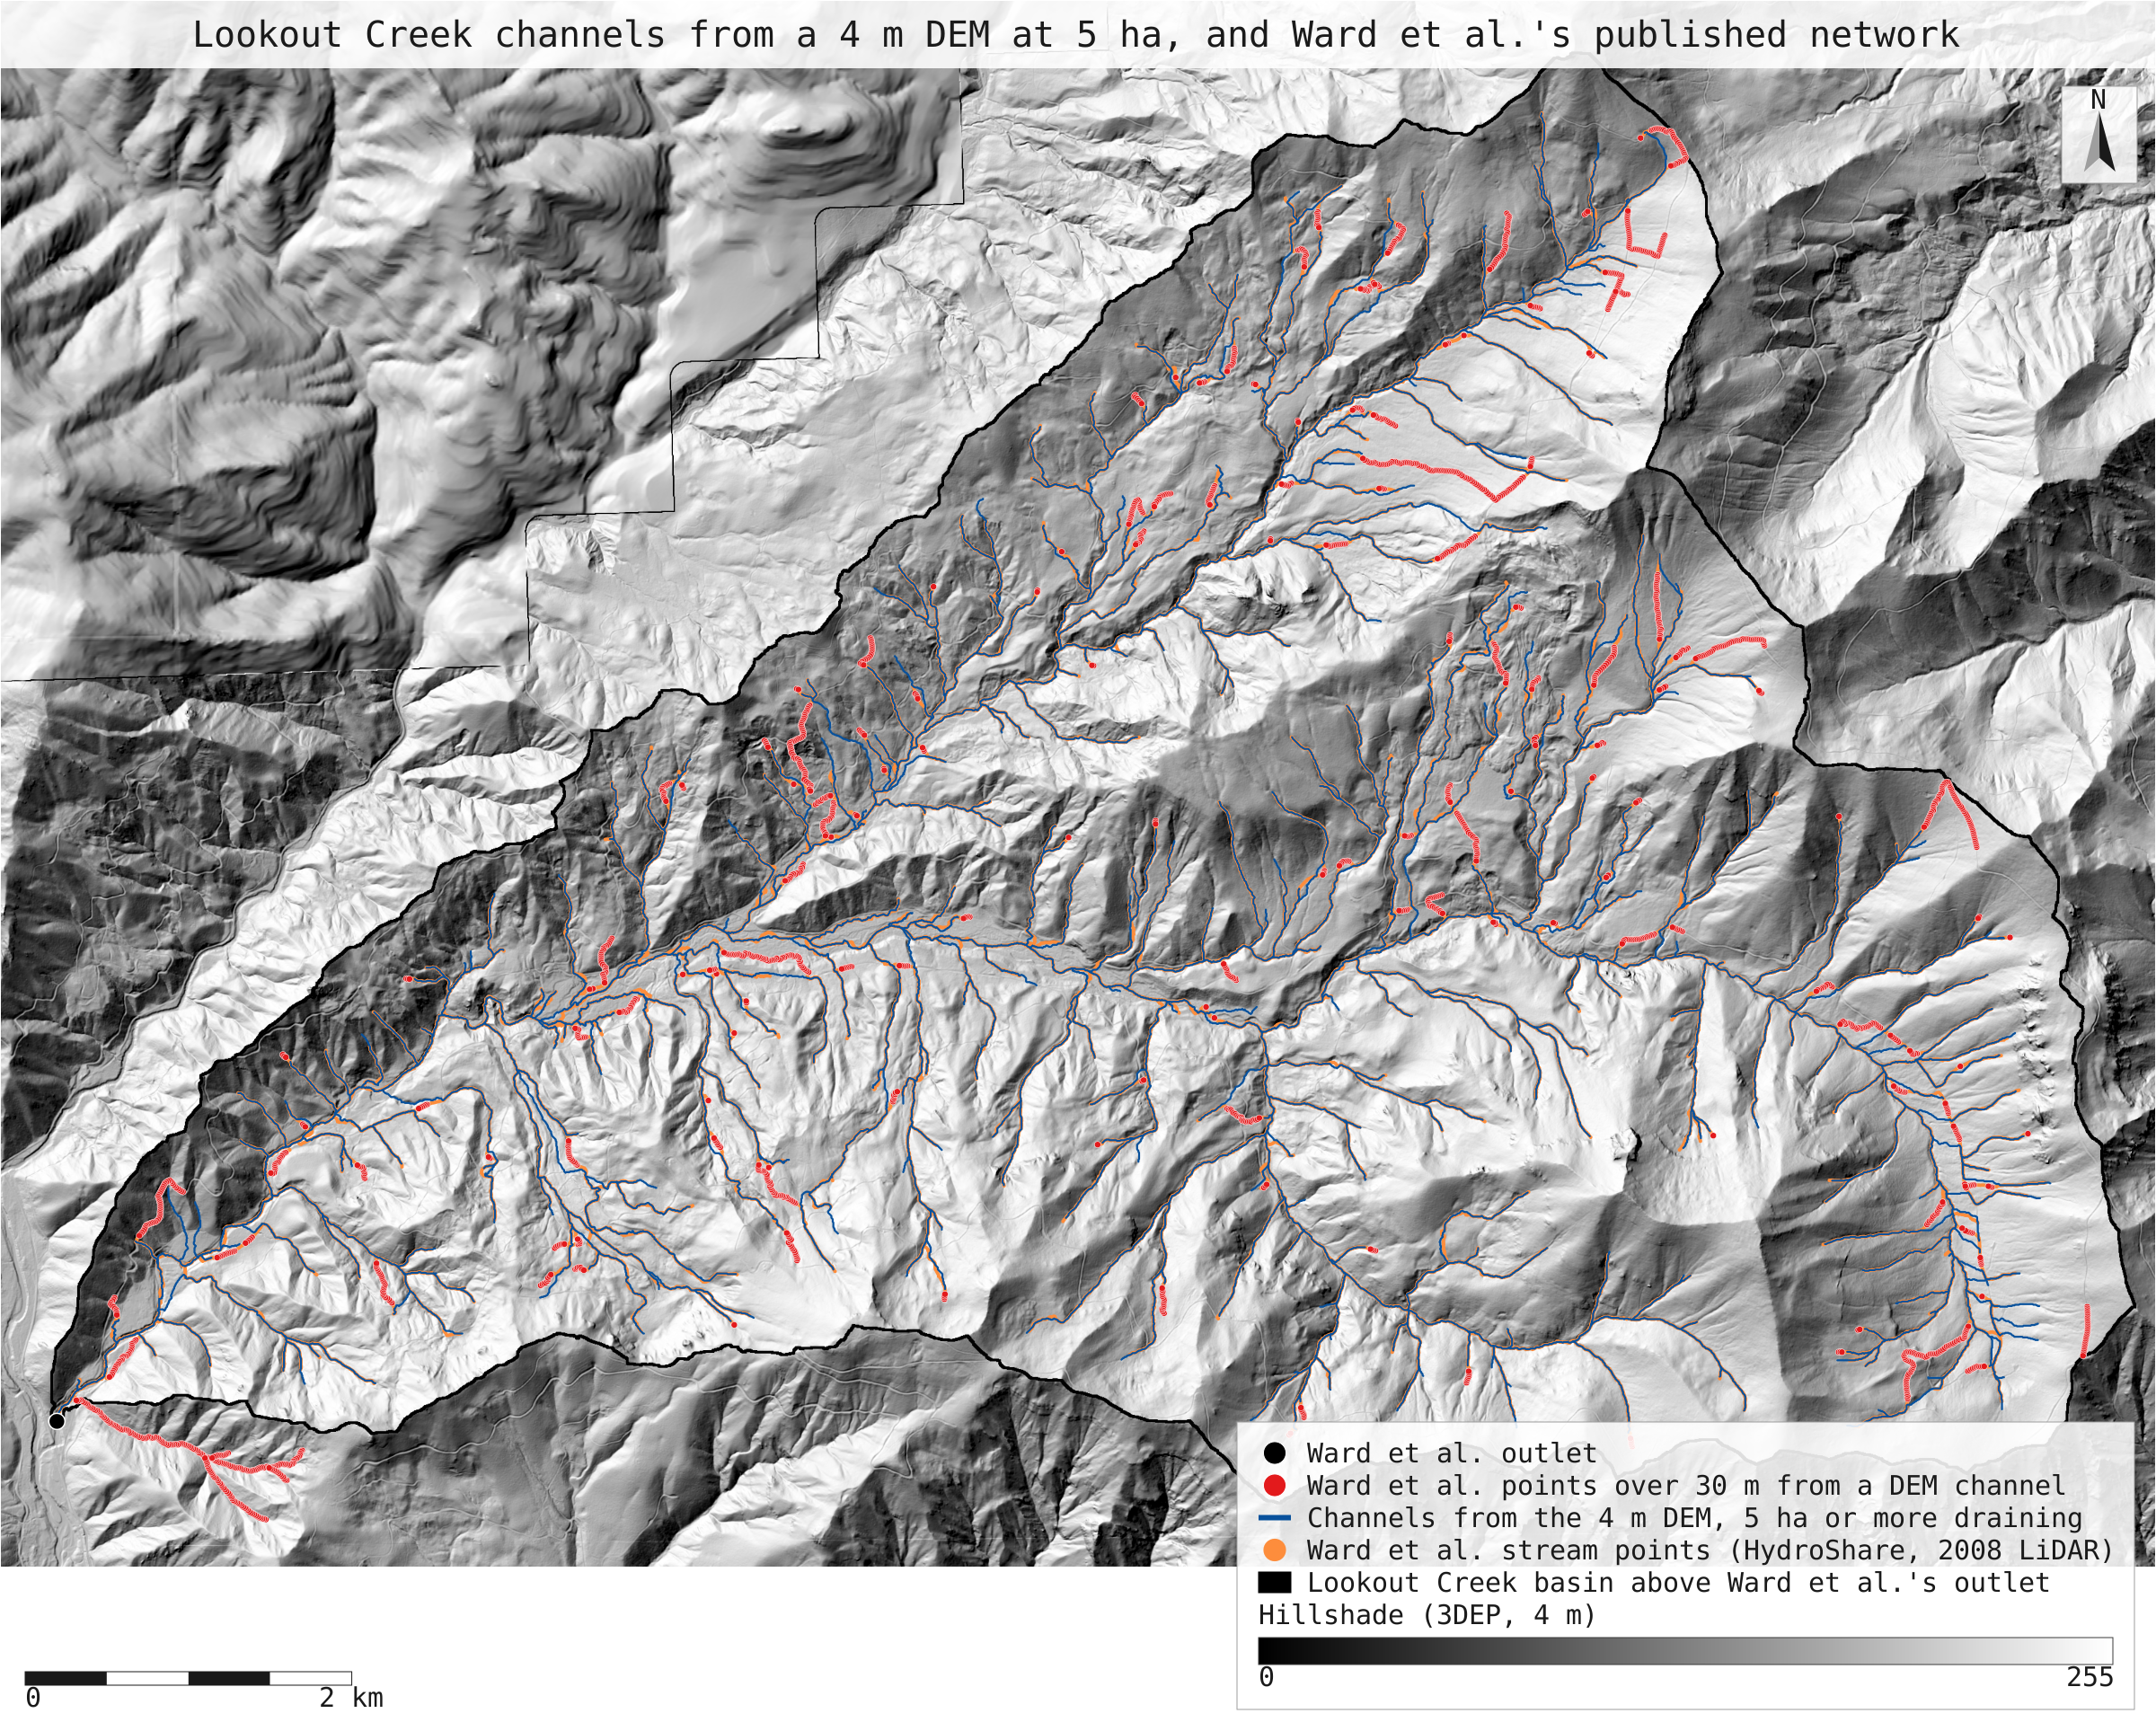
- ward_network.svg: the full-detail map
Limits
- Not the same terrain model. Ward et al. used the 2008 1 m bare-earth LiDAR DEM. HJ Andrews distributes it (GI010, gi01001) as a 1.9 GB uncompressed E00 export, and OpenTopography as a 323 MB .img raster; NativeGIS opens neither yet (an E00 that large exceeds its in-memory text limit, and .img is not a format it reads). This run uses USGS 3DEP elevation exported at 4 m, the finest cell a single request to the public service returned over the basin (3 m requests failed). The only 1 m 3DEP DEM over the basin comes from a 2021 LiDAR flight (OR McKenzie River 2021), so the stand-in most likely comes from that later flight; bare-earth terrain under forest changes little in 13 years, but road fills and small slides can differ.
- The flow algorithm differs too: D8 here, the Seibert and McGlynn single-direction algorithm in Ward et al.'s modified toolbox. Both send each cell's water one way, but channel heads at exactly 5 ha land in different cells.
- Ward et al. (2020) use this network to simulate how far the flowing network contracted between 1953–1962 and 2009–2018 (24.1% shorter in September). Those figures need discharge records (HJ Andrews HF004) behind a registration form, and a flow model; they are not reproduced.
- The 10 m and 30 m tests ask whether a point or cell has a counterpart nearby, not whether the two networks start at the same head. Published points are about 10 m apart along the valley, so point counts stand in for length.