Your board, analysed before it is built.
IR drop, impedance, glass-weave skew, statistical eyes to BER 1e-12 and via life from the file you already have. Shown here on two real open-hardware boards, read straight from their KiCad files.
- ULX3S on JLCPCB meets the fab's UL-recognized construction (UL 796 design check).
- ULX3S is IPC-6012 Class 2 ready (100% via ring retention under the fab's drill tolerance).
Design checks against the standards, not certificates issued by their bodies. Each line is a shipped entry in our standards claims register.
Pick a copper layer, drag to pan, wheel or pinch to zoom, hover for V, |J| and T. Switch to 3D for the stackup, click a red cut marker for the trace cross-section. Full-screen viewer
Power on a real FPGA board
The ULX3S is an open-hardware Lattice ECP5 board. Every copper pour, trace and via on its 3.3 V and 1.1 V rails comes from the board file, the regulator feeds each rail and the chips draw their load. The 3.3 V rail drops 3.58 mV at its farthest load, 2.2% of the ±5% window.
One change, before and after
All of the 3.3 V current climbs through a single via into the inner plane. Two more vias beside it cut the worst drop from 3.58 mV to 3.33 mV (7.1% lower) and the busiest via from 0.48 A to 0.25 A.
| Load on +3V3 | Part | Current we drew | Worst drop at its pins |
|---|---|---|---|
| U1 | ECP5 VCCIO banks on +3V3 | 0.10 A | 2.31 mV |
| U9 | ESP32 module | 0.25 A | 3.58 mV |
| U2 | SDRAM MT48LC16M16A2 | 0.10 A | 0.74 mV |
| U10 | SPI flash IS25LP128F | 0.02 A | 2.70 mV |
| Y1 | 25 MHz oscillator | 0.01 A | 2.54 mV |
Basis
DC solve of the net's copper on all four layers with every via as a barrel resistor, copper resistance at its solved temperature (25 °C ambient). Source at the regulator's output jumper; loads at every power pin of each part, with the currents listed. Tolerance ±5% of nominal from the ECP5 recommended operating conditions. Board: ULX3S rev v3.1.7, github.com/emard/ulx3s.
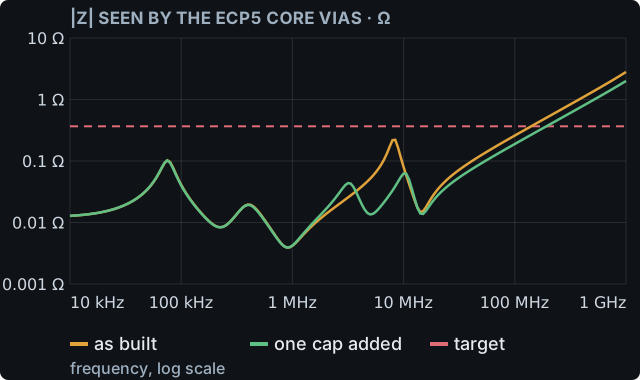
Impedance of the core rail, 10 kHz to 1 GHz
Seen from the ECP5's core vias, the 1.1 V rail stays under its 0.37 Ω target (±5% of nominal over a 0.15 A load step) up to 141 MHz. Above that the loops that mount its 3 caps take over: each via pair adds 0.71 nH. Adding one 0402 1 µF X5R cap on the core vias holds the rail under target to 200 MHz and cuts the impedance at 100 MHz from 0.26 Ω to 0.19 Ω, 27% lower.
Basis
Plane-pair cavity solve on the real outline of the core pour and the ground plane under it, with dielectric loss and skin-effect copper; the first cavity resonance sits at 2.53 GHz. Caps from the board's footprints with a typical ESR and ESL for their case size and DC-bias derating; values by footprint size, since the board file carries no BOM. Mounting inductance of each cap from its power and return via pitch and barrel size. Regulator as a resistance and inductance with its own output caps, behind the jumper and the feed trace. Target from the rail tolerance over half the assumed core current.
Impedance, straight from the board file
The Antmicro Signal Integrity Test Board is open hardware. Antmicro designs its single lines 0.2 mm wide for 50 Ω; our solve of the board's stackup at that width gives 50.6 Ω. As drawn in the board file, 0.185 mm wide, the PASS line solves to 52.7 Ω, inside the ±10 % a controlled-impedance order allows.
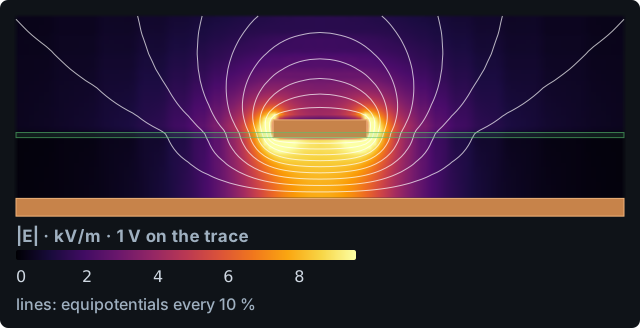
| Trace | Result | Reference |
|---|---|---|
| PASS, 0.2 mm design width | 50.6 Ω | 50 Ω, Antmicro's published line target |
| PASS as drawn, 0.185 mm | 52.7 Ω | ±10 % fab tolerance on 50 Ω |
| DIFF pair as drawn, 0.185 mm / 0.15 mm gap | Zdiff 88.9 Ω Zodd 44.5 Ω, Zeven 59.8 Ω | 100 Ω typical for a differential pair |
| PASS effective Dk | 3.11 | solved from the stackup |
Open the Antmicro board in the viewer above and pick Z0 to see every trace coloured by its impedance.
Basis
Quasi-TEM 2-D cross-section of each trace's width, copper and the stackup in the Antmicro board file; the pair as a coupled solve. Board: github.com/antmicro/signal-integrity-test-board, Apache-2.0. Measured VNA reference for the coming overlay: github.com/antmicro/gerber2ems, examples/stub_short, Apache-2.0.
Impedance yield across the fab's tolerances
All 2,000 simulated builds of a 0.15 mm microstrip land within ±10 % of its 55.54 Ω nominal, and 99.75% within ±7 %. The differential pair at a 0.2 mm gap does the same: all 1,000 builds within ±10 % of 99.02 Ω, 99.80% within ±7 %. Trace width moves impedance most, then dielectric height; etch factor barely registers.
What moves impedance
Each parameter pushed to the edge of its spread with everything else at nominal; the bar shows how far the impedance goes.
| Parameter | Nominal | Spread | Single line swing | Pair swing |
|---|---|---|---|---|
| Trace width | 0.15 mm | ±10 % | 5.58 Ω | 9.59 Ω |
| Dielectric height | 0.1 mm | ±8 % | 4.74 Ω | 6.61 Ω |
| Laminate Dk | 4.2 | ±5 % | 2.31 Ω | 3.90 Ω |
| Plating thickness | 15 µm | ±12 µm | 2.01 Ω | 5.70 Ω |
| Etch factor | 3.0 | ±20 % | 0.91 Ω | 1.55 Ω |
Basis
Each build draws trace width, etch factor, dielectric height, laminate Dk and plating thickness independently from normal distributions, with the spreads above at three sigma, etches the trace to its trapezoid and solves the line at its mean etched width; insertion loss over 10 cm at 10 GHz. The swing chart drives one parameter at a time to its three-sigma extremes with the others at nominal. Builds are seeded, so every one is reproducible.
Glass weave skew, from the real cell
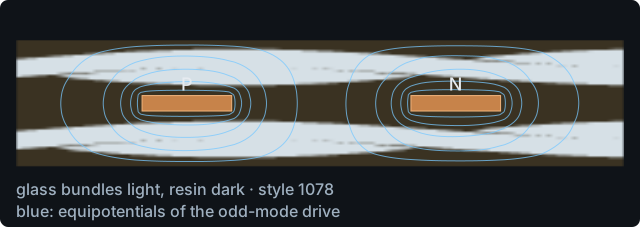
Rotate the route a few degrees off the weave and the skew drops to 0.09 to 0.35 ps/in across four glass styles, in line with the 0.2 ps/in Samtec measured on rotated routes: 20–40× less than along the grain.
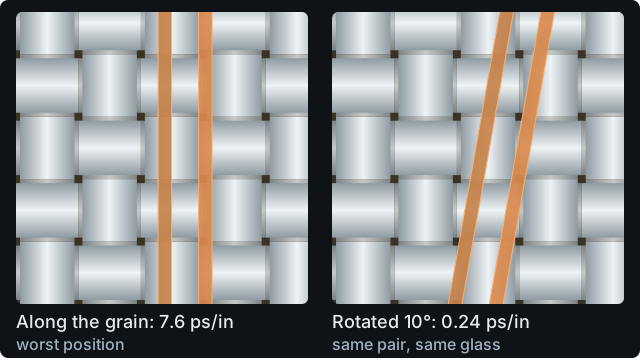
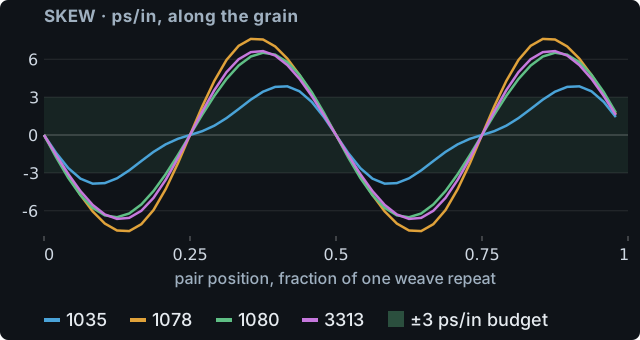
Along the grain, skew swings sinusoidally with where the pair sits on the glass. At the worst position it reaches 7.6 ps/in on 1078: the perfectly aligned upper bound, since a real route wanders off the grain. Measured worst cases sit under it; the bound is 2.3×, 1.5× and 1.6× the worst Samtec (Megtron 6) and Isola (I-Speed) published for 1035, 1078 and 3313.
| Glass | Rotated | Along grain | Published | Ratio |
|---|---|---|---|---|
| 1035 | 0.09 | 3.9 | 1.7 Megtron 6 | 2.3× |
| 1078 | 0.35 | 7.6 | 5.0 Megtron 6 | 1.5× |
| 1080 | 0.24 | 6.5 | — | — |
| 3313 | 0.28 | 6.6 | 4.2 I-Speed | 1.6× |
Worst-case skew in ps/in. Along grain: the model's worst position; published: the measured worst case and its laminate; ratio: along grain / published.
Basis
Worst is the single worst lateral position across one weave repeat with the pair exactly along the grain; rotated routes at 7, 10 and 11.3 degrees over one inch. Published worst cases: Samtec, EDI CON 2017, measured along the grain (1035, 1078); Isola and Simbeor, worst observed pair over 14 in (3313). Our laminate: Isola 370HR class, resin Dk calibrated to the 370HR datasheet Dk. Each published figure is cited to its source in our reference-band register.
Eye diagrams at 25 and 56 Gbps
Eye open at 1e-12. The Antmicro PASS line at 56 Gbps NRZ keeps 1.02 V by 13.7 ps at BER 1e-12 as drawn, and 1.27 V by 14.7 ps with Tx FFE, CTLE and a 2-tap DFE optimised for that BER.
Back-drill buys 1,726 mV of eye height at 56 Gbps. Solved channel responses of the Antmicro PASS line (45.4 mm) and DIFF pair (55.4 mm) at their board-file geometry, and the same cross-sections at twice the length. Switch data rate, surface roughness, equalisation, pair skew and the via (none, with via, back-drilled); the marker sits at the widest opening. Coloured contours are the statistical eye at BER 1e-6 to 1e-15; the strip below is its bathtub.
Basis
Channel impulse response from the solved RLGC of the PASS and DIFF traces, superposed with PRBS7 (NRZ) or PRBS15 (PAM4) data at the selected rate. Roughness and a single-pole CTLE are toggles. The via toggle puts one layer-change via in the middle of the DIFF pair on the 8-layer cell: with its full stub, or back-drilled. Contours and bathtub: the statistical eye of the same pulse response, every cursor's symbol distribution convolved, with 0.01 UI rms random jitter, 0.05 UI dual-Dirac deterministic jitter and 5 mV rms noise; the optimiser searches Tx FFE pre and post taps and CTLE peaking with an ideal DFE. The statistical eye follows the same via and CTLE selection. No connector launches or crosstalk.
Impedance along the line
The TDR view, from S-parameters. Reflection data is extrapolated to DC, windowed and inverse-transformed into a step response, then read as impedance against distance for the rise time you pick. The Antmicro stub_short board is shown twice through the same pipeline: the measured VNA reflection and our line-only model. The model has no SMA launch, stub or fixture, so the measured launch dip and the later bump have no counterpart in it, and its level sits a few ohms above the measured trace. Other cases: a uniform line, a higher-impedance section, and a differential via.
Basis
Real part of the reflection held and imaginary part ramped to zero below the lowest measured frequency, Kaiser window, inverse FFT, cumulative sum, linear-ramp rise time, then impedance from the reflection coefficient and distance from half the round-trip time at the PASS line's effective velocity. The profile is computed from the same S-parameters the eye diagrams use.
Via life before you drill
An 8-layer, 1.6 mm board with a 0.25 mm plated-through hole cycling 25 to 150 °C: the barrel stays elastic, at 243 MPa by IPC-TR-579 against copper's 250 MPa yield, and the IPC-TR-579 fatigue equation gives it 820,000 cycles. Lead-free reflow is where the barrel works hard: 113 excursions to 260 °C to failure, so six reflows use 5.3% of its life.
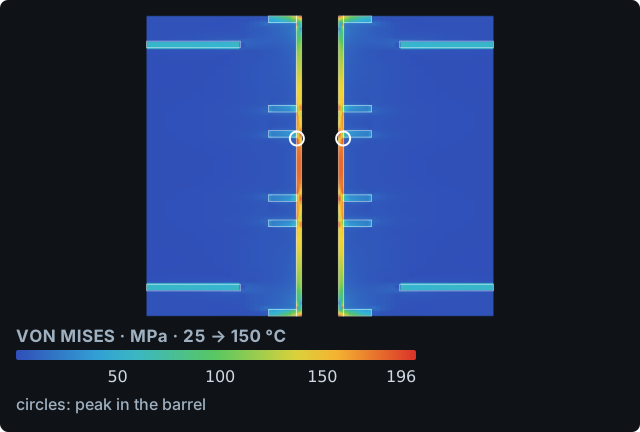
The resolved model of the same cell puts mid-barrel strain at 0.23%, peaking at 196 MPa in the barrel.
Basis
25 µm plating, isolated via. IPC-TR-579 barrel force balance, then the IPC-TR-579 (Engelmaier) fatigue equation on the total barrel strain with as-plated copper at 320 MPa tensile strength, 80 GPa modulus and 0.20 ductility; an axisymmetric thermo-elastic model of the same cell alongside. Swept over board thickness and drill.
Survives the shaker
A 273 Hz first mode for the 160 by 100 mm, 1.6 mm board with five parts loaded on it (Rayleigh-Ritz, simply-supported sin basis, lumped component point masses). On a 8.9 g rms random profile the board centre moves 0.253 mm at three sigma, and the Steinberg criterion for a 20-million-cycle life leaves every part with margin. The drop is tighter: a 1,500 g, 0.5 ms half-sine (JESD22-B111 condition B) puts 3,491 µε of peak strain at the BGA against a 1,500 µε limit.
| Part | 3σ deflection | Steinberg allowable | Vibration margin | Drop peak strain | Drop margin |
|---|---|---|---|---|---|
| U1 BGA | 0.253 mm | 0.310 mm | 1.2× | 3,491 µε | 0.4× |
| U2 QFP | 0.141 mm | 1.316 mm | 9.3× | 1,825 µε | 0.8× |
| U3 LCC | 0.120 mm | 0.771 mm | 6.4× | 1,470 µε | 1.0× |
| J1 DIP | 0.070 mm | 1.028 mm | 14.6× | 881 µε | 1.7× |
| C1 DIP | 0.056 mm | 1.991 mm | 35.5× | 635 µε | 2.4× |
Margin is allowable divided by demand; under 1.0 fails. Drop margin is the 1,500 µε strain limit divided by the peak strain at the part.
Basis
Rayleigh-Ritz plate modes with the parts as lumped masses, simply-supported edges (mounting-hole supports not modelled); bare plate 351 Hz matches the closed form. Miles' equation is within +0.14% of a full integration of the power spectrum for the first mode. Random profile is an input, flat 0.04 g²/Hz from 20 to 2000 Hz, in the range of MIL-STD-810H Method 514 ground vehicle levels; the response is 16.8 g rms at the first mode with Q from the square-root-of-frequency rule. Steinberg allowable deflection 0.00022 B / (C h r √L) inches. Drop by time integration of the mode.
Matches the fabs
11 of 17 published fab geometries (65%) land within ±2% of the fab's own number; all 17 are within ±5%, worst 4.9%, and nothing is fitted. Each row is a stackup and trace width that a fab publishes, solved as drawn with a rectangular trace and the fab's printed Dk.
| Fab geometry | Fab target (Ω) | Fab predicted (Ω) | NativeCAD (Ω) | Difference |
|---|---|---|---|---|
| OSH 4L L1 microstrip, ref L2 | 50.0 Ω | 49.8 Ω | 50.6 Ω | +1.65% (converged to 0.12 %) |
| OSH 4L L1 diff microstrip, ref L2 | 90.0 Ω | 91.5 Ω | 92.1 Ω | +0.68% (converged to 0.26 %) |
| OSH 4L L1 diff microstrip, ref L2 | 100.0 Ω | 100.3 Ω | 101.2 Ω | +0.90% (converged to 0.26 %) |
| OSH 6L L1 microstrip, ref L2 (row 1) | 50.0 Ω | 50.1 Ω | 50.9 Ω | +1.59% (converged to 0.17 %) |
| OSH 6L L1 microstrip, ref L3 across void L2 (row 2) | 50.0 Ω | 49.9 Ω | 50.8 Ω | +1.79% (converged to 0.13 %) |
| OSH 6L L1 diff microstrip, ref L2 (row 3) | 85.0 Ω | 84.5 Ω | 85.4 Ω | +1.08% (converged to 0.22 %) |
| OSH 6L L1 diff microstrip, ref L2 (row 4) | 90.0 Ω | 89.6 Ω | 90.6 Ω | +1.06% (converged to 0.22 %) |
| OSH 6L L1 diff microstrip, ref L2 (row 5) | 100.0 Ω | 100.1 Ω | 101.4 Ω | +1.32% (converged to 0.26 %) |
| OSH 6L L2 stripline, ref L1/L3 (row 6) | 50.0 Ω | 50.2 Ω | 48.6 Ω | -3.17% (converged to 0.15 %) |
| OSH 6L L2 diff stripline, ref L1/L3 (row 7) | 90.0 Ω | 89.8 Ω | 87.1 Ω | -3.04% (converged to 0.15 %) |
| OSH 6L L2 diff stripline, ref L1/L3 (row 8) | 100.0 Ω | 99.3 Ω | 95.9 Ω | -3.47% (converged to 0.18 %) |
| OSH 6L L3 stripline, ref L2/L4 (row 9) | 50.0 Ω | 50.0 Ω | 49.0 Ω | -1.97% (converged to 0.07 %) |
| OSH 6L L3 diff stripline, ref L2/L4 (row 10) | 90.0 Ω | 89.9 Ω | 87.4 Ω | -2.84% (converged to 0.11 %) |
| OSH 6L L3 diff stripline, ref L2/L4 (row 11) | 100.0 Ω | 99.1 Ω | 96.0 Ω | -3.13% (converged to 0.12 %) |
| JLCPCB JLC04161H-7628 top microstrip, ref L2 | 50.0 Ω | — | 47.5 Ω | -4.93% (converged to 0.06 %) |
| JLCPCB JLC04161H-7628 top diff microstrip, ref L2 | 90.0 Ω | — | 88.5 Ω | -1.67% (converged to 0.10 %) |
| JLCPCB JLC04161H-7628 top diff microstrip, ref L2 | 100.0 Ω | — | 99.6 Ω | -0.44% (converged to 0.10 %) |
Basis
Every stackup and width is read from the cited fab page, with its URL and retrieval date kept alongside the result. The comparison is against the fab's printed predicted impedance where it gives one, otherwise its target. Mask is modelled conformal from the fab's published coating thicknesses. Nothing is fitted to the fab numbers.
Return-path check
Pre-compliance screen: 1 return-path finding before stitching, 0 after. A clock trace with a 0 MHz knee crosses a split in its ground plane on a four-layer synthetic board. One stitching capacitor within 21.4 mm of the crossing gives the return current a path and clears the finding. The radiated figures below are closed-form pre-compliance estimates, not a compliance test; only measurement in an accredited chamber shows compliance.
| Estimate (worked-example inputs) | Radiated (dBµV/m) | Class B limit (dBµV/m) | Margin (dB) | Result |
|---|---|---|---|---|
| Differential-mode loop at 50 MHz | 52.84 | 40.0 | -12.84 | over the limit |
| Common-mode cable at 50 MHz | 46.44 | 40.0 | -6.44 | over the limit |
| Band | Class B limit (dBµV/m) |
|---|---|
| 30 to 88 MHz | 40.0 |
| 88 to 216 MHz | 43.5 |
| 216 to 960 MHz | 46.0 |
| above 960 MHz | 54.0 |
Basis
Limits: FCC 47 CFR 15.109(a) Class B, 3 m, quasi-peak. Checker and closed forms: Ott small-loop and short-dipole estimates, run on the committed worked example. The estimate inputs are our own worked-example inputs, not figures quoted from a textbook. Knee frequency from rise time by the Johnson and Graham rule; a stitch counts when it sits within a twentieth of a wavelength at the knee.
Trace current capacity
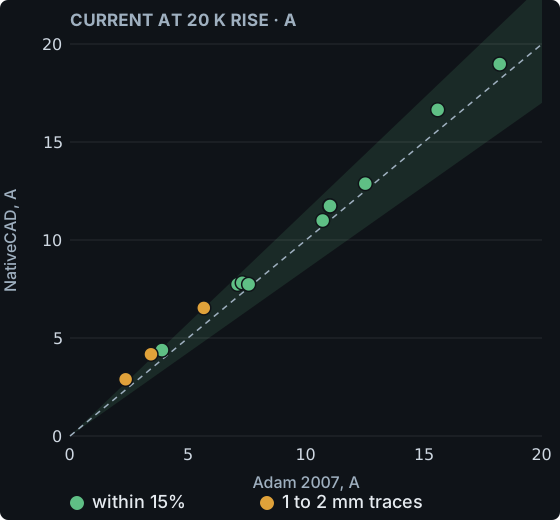
10 of 13 published trace-current cases land within 15% of the open reference, the best of them within 12.5%. Outer and inner layers, with and without a back plane, two copper weights, all at a 20 K rise. The reference is Adam 2007 (Haus der Technik), an open paper with its own simulations and correlation. The misses are the narrowest traces, where we carry slightly more current than the paper, and the grid is converged there.
| Trace | Adam 2007 | NativeCAD | Difference |
|---|---|---|---|
| 5 mm, 1 oz outer | 7.10 A | 7.74 A | 9.0% |
| 5 mm, 1 oz outer, back plane | 11.00 A | 11.74 A | 6.7% |
| 5 mm, 1 oz inner | 7.30 A | 7.82 A | 7.1% |
| 2 mm, 1 oz outer | 3.90 A | 4.38 A | 12.5% |
| 5 mm, 1 oz outer | 7.57 A | 7.74 A | 2.2% |
| 5 mm, 2 oz outer | 10.71 A | 11.00 A | 2.7% |
| 10 mm, 1 oz outer | 12.51 A | 12.88 A | 2.9% |
| 2 mm, 1 oz outer, back plane | 5.67 A | 6.53 A | 15.3% narrow trace |
| 5 mm, 1 oz outer, back plane | 11.02 A | 11.74 A | 6.5% |
| 5 mm, 2 oz outer, back plane | 15.58 A | 16.64 A | 6.8% |
| 10 mm, 1 oz outer, back plane | 18.21 A | 18.98 A | 4.2% |
| 1 mm, 1 oz outer | 2.36 A | 2.89 A | 22.7% narrow trace |
| 1 mm, 1 oz outer, back plane | 3.43 A | 4.17 A | 21.6% narrow trace |
Limits used below: 68.3 A/mm² outer, 34.2 A/mm² inner, at a 10 K rise. A 0.3 mm drill via with 25 µm plating has 0.026 mm² of barrel and carries 0.95 A at that rise.
| ULX3S rail check | Solved | Limit | Result |
|---|---|---|---|
| +3V3 — Peak current density, B.Cu | 20.5 A/mm² | 68.3 A/mm² | PASS |
| +3V3 — Busiest via current | 0.48 A | 1.25 A | PASS |
| +3V3 — Trace rise | 0.024 K | 10.000 K | PASS |
| +1V1 — Peak current density, In1.Cu | 14.3 A/mm² | 34.2 A/mm² | PASS |
| +1V1 — Busiest via current | 0.30 A | 1.25 A | PASS |
| +1V1 — Trace rise | 0.035 K | 10.000 K | PASS |
Basis
Model: the NativeCAD board thermal solver on a 5 in by 3 in epoxy-glass board in still air, trace along the long edge. Rail currents, current density and via currents come from the committed ULX3S power-delivery solve; the load currents are the assumptions listed with that case. Limits from the closed-form fit on a 1 mm wide reference trace.
Channel COM, checked against the reference
7 of 7 channels agree with the IEEE 802.3 reference implementation to under 0.001 dB, far inside the ±0.1 dB correlation window. Every channel clears the 3 dB Channel Operating Margin limit, from a 100 mm trace to a 1000 mm route with vias and three crosstalk aggressors.
| Channel | IL at fb/2 | Aggressors | NativeCAD | Reference | Difference |
|---|---|---|---|---|---|
| short_100mm | 1.5 dB | 0 | COM 7.76 dB (passes the ≥3 dB limit) | 7.76 dB | 0.000 dB |
| mid_300mm | 4.5 dB | 0 | COM 7.86 dB (passes the ≥3 dB limit) | 7.86 dB | 0.000 dB |
| long_700mm | 10.5 dB | 0 | COM 6.94 dB (passes the ≥3 dB limit) | 6.94 dB | 0.000 dB |
| mid_300mm_via | 4.6 dB | 0 | COM 4.32 dB (passes the ≥3 dB limit) | 4.32 dB | 0.000 dB |
| mid_300mm_xt | 4.5 dB | 3 | COM 7.97 dB (passes the ≥3 dB limit) | 7.97 dB | 0.000 dB |
| long_700mm_via_xt | 10.6 dB | 3 | COM 5.58 dB (passes the ≥3 dB limit) | 5.58 dB | 0.000 dB |
| vlong_1000mm_via_xt | 15.2 dB | 2 | COM 4.44 dB (passes the ≥3 dB limit) | 4.44 dB | 0.000 dB |
Basis
Annex 93A style COM with Tx FFE, CTLE and DFE on 53.125 GBd PAM4, 802.3ck-style parameters. Each channel's S-parameters go through the same optimisation in NativeCAD and in PyChOpMarg 3.1.2, the open-source Python Annex 93A/178A COM that its author correlates against the IEEE MATLAB code. Equalizer settings chosen by the two agree on every channel.
Get this breakdown for your board
Bring KiCad, Gerber or IPC-2581. NativeCAD gives you IR drop and current on every rail, impedance on every controlled trace, weave skew on your glass, eyes on your fastest links and life on every via, before the first panel is built.
Boards: Antmicro Signal Integrity Test Board, Apache-2.0; ULX3S by Radiona and EMARD, modified MIT. Measured VNA reference: antmicro/gerber2ems, Apache-2.0. Reference bands: Samtec, Isola and Simbeor, IPC-TR-579. Built by FeatureBoard.
More demos
All demos →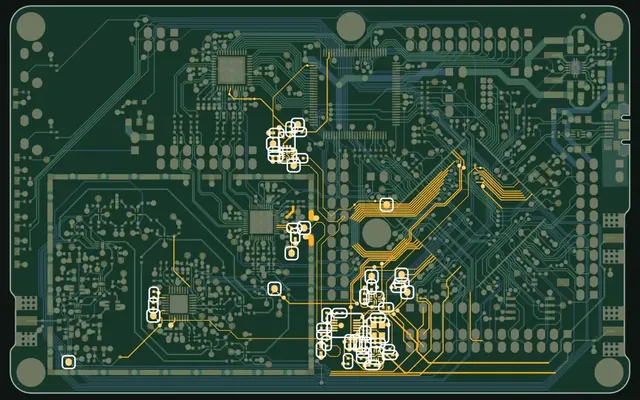
What each parts-list change did to the board
Every parts-list change in real open-hardware projects, traced to what it did to the circuit board.
162 commits read Simulation coupling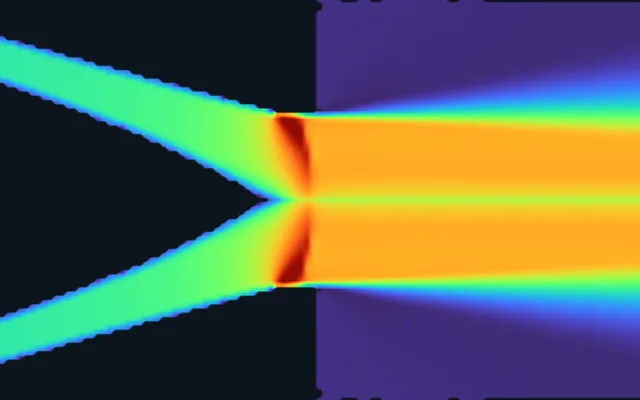
A jet engine, solved: compressible CFD, chemistry and a full start-up
Compressible CFD, combustion chemistry and a full start-up in one loop, every number traced to its run.
1,098.5 K vs 1,100 K target Transaxle checks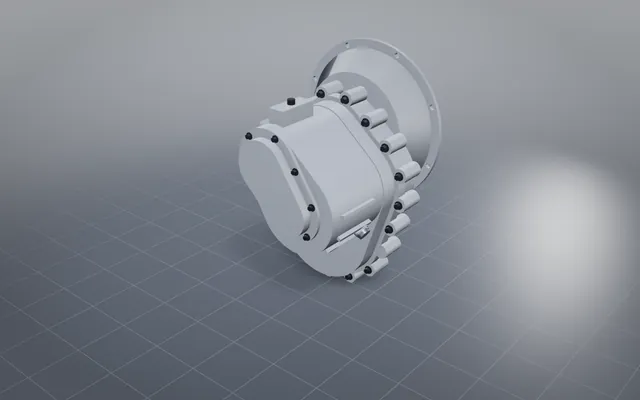
The checks your checker forgets, run on a car transaxle
Tolerance stacks and a full fastener audit catch a bearing preload problem as drawn, then prove the fix.
175 parts · 30 fasteners Drawings to STEP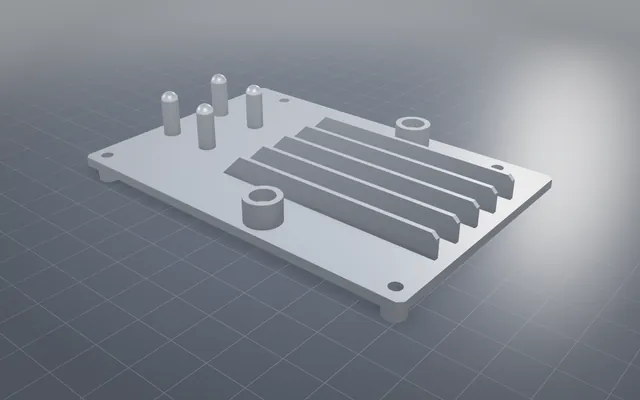
Manufacturing drawings in, STEP out, checked against the original
Real manufacturing drawings become exact 3D models, each matched against the official model.
6 of 6 NIST parts matchedBuild your own part with NativeCAD
Free for education and makers with a registered key · $200 per seat per year · Kernel SDK for products.